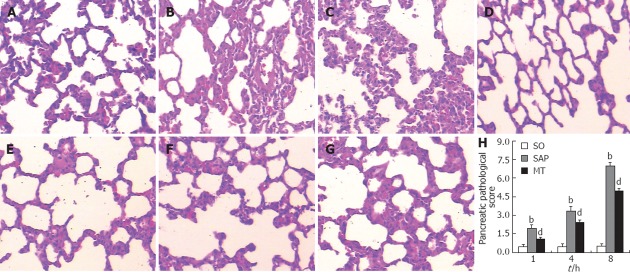
Figure 1.
Histology of pulmonary tissues and pathological scores of pancreatic tissues from rats in the sham operation, severe acute pancreatitis, and melatonin treatment groups. A-C: Histological changes of pulmonary tissues in the SAP group (A) 1 h, (B) 4 h, and (C) 8 h after experimental induction of SAP; D: Histological changes of pulmonary tissues in the SO group 8 h after mock induction of SAP; E-G: Histological changes of pulmonary tissues in the MT group (E) 1 h, (F) 4 h, and (G) 8 h after experimental induction of SAP (hematoxylin and eosin stain; ×200). H: Pathological scores of pancreatic tissues (n = 8). bP < 0.01 vs the MT group; dP < 0.01 vs the SO and MT groups. SO: Sham operation; SAP: Severe acute pancreatitis; MT: Melatonin treatment.

