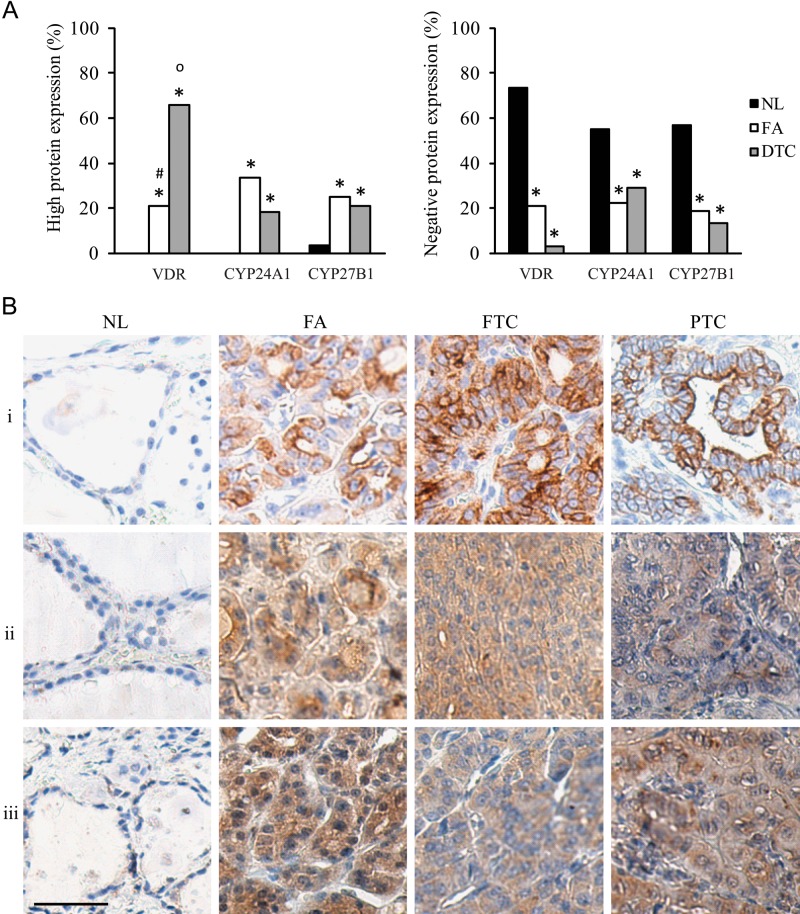
Figure 3.
“High” (left histogram) and “negative” (right histogram) protein expression profiles of vitamin D receptor (VDR), CYP24A1, and CYP27B1 in normal thyroid tissue (NL), follicular adenoma (FA), and differentiated thyroid cancer (DTC) (A); and representative photographs of “high” VDR, CYP24A1, and CYP27B1 staining in NL, FA, and DTC tissues (B). Immunohistochemistry expression was considered high when the H-score ≥4 (B). (A) High VDR, CYP24A1, and CYP27B1 staining was present in FA and DTC samples, whereas NL tissue was usually characterized by absent staining for the 1,25(OH)2D3 metabolizing proteins. (B) (i) High VDR expression, (ii) high CYP24A1 expression, and (iii) high CYP27B1 expression; staining in NL, FA, and DTC (FTC and PTC). Kidney tissue and omission of the primary antibody provided, respectively, the positive and negative control. Scale bar: 50 µm. *p<0.05 vs NL; op<0.05 vs FA; #p<0.05 vs DTC.

