Figure 1.
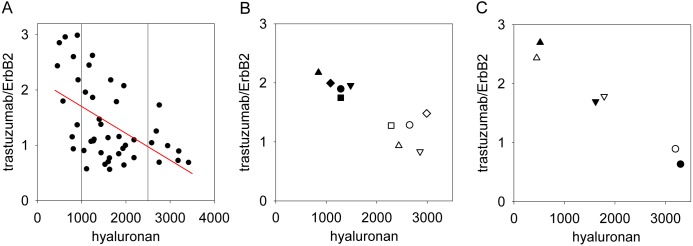
High hyaluronan density in tissue samples predicts low binding of trastuzumab. (A) Tissue samples were stained with trastuzumab (directly labeled with Alexa Fluor 546) and with an anti-ErbB2 antibody (OP15, indirectly labeled with Alexa Fluor 647–goat anti-mouse IgG) binding to an epitope in the intracellular domain of ErbB2, and hyaluronan was labeled with hyaluronic acid binding complex (HABC; indirectly stained with Alexa Fluor 488–streptavidin). The hyaluronan density and the trastuzumab/ErbB2 intensity ratio were calculated in the membrane mask (see Fig. 2). These parameters were averaged for each patient; therefore, every point in the graph represents the mean value of a single patient. The red line was fitted to the data points by linear regression (r = −0.52). The vertical reference lines show how the data set was divided into three groups (low, medium, and high hyaluronan density) for further statistical analysis. (B) Five patients whose samples displayed high hyaluronan content were chosen to demonstrate the effect of hyaluronidase treatment. Six sections from each of the selected patients were analyzed. Half of the samples from each patient were digested with hyaluronidase (filled symbols), whereas the rest of them were left untreated (open symbols). Sections were labeled in the same way as in part A, and the trastuzumab/ErbB2 ratio and the hyaluronan content were averaged for every patient. Identical shapes of the open and filled symbols correspond to the same patients. The increase in the normalized binding of trastuzumab was found to be significant using Student’s paired t-test (p<0.01). (C) Three tissue samples were selected representing low, medium, and high hyaluronan density, and they were labeled as described in the legend to part A, but the fluorescent dyes for trastuzumab and OP15 were reversed—that is, trastuzumab directly labeled with Alexa Fluor 647 and OP15 indirectly labeled with Alexa Fluor 546–goat anti-mouse IgG (filled symbols, reverse labeling). Open symbols represent the results of the labeling procedure of the same three samples as described in part A (“forward” labeling). Fluorescence intensities of the HABC, trastuzumab, and OP15 images measured in the reverse-labeled samples were normalized to the corresponding fluorescence intensities of the forward-labeled samples. Identical shapes of the open and filled symbols correspond to the same samples labeled according to the two different labeling protocols.

