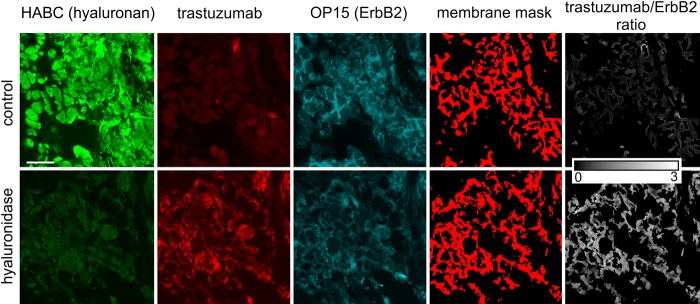
Figure 3.
Representative images showing the effect of hyaluronidase treatment on the binding of trastuzumab. A tissue section was treated with hyaluronidase, whereas another sample from the same patient served as a control. Afterward, tissue samples were labeled and images were processed as described in Materials and Methods. The scale bar, valid for every image, is 20 µm.

