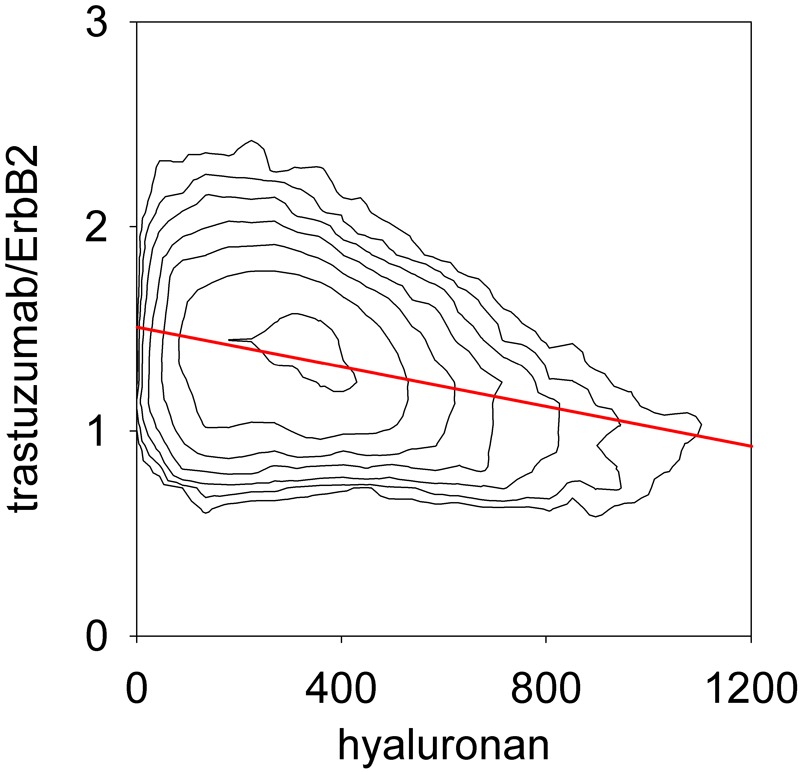
Figure 4.

Anticorrelation between hyaluronan density and trastuzumab binding in a single confocal image. A tissue specimen was stained with trastuzumab, OP15 (for ErbB2), and hyaluronic acid binding complex (HABC). The trastuzumab/ErbB2 ratio and the hyaluronan density were evaluated in the membrane mask as described in Materials and Methods and they are displayed in a contour plot. The red line represents the linear regression of the trastuzumab/ErbB2 ratio on hyaluronan density (r = −0.3).
