
Figure 5.
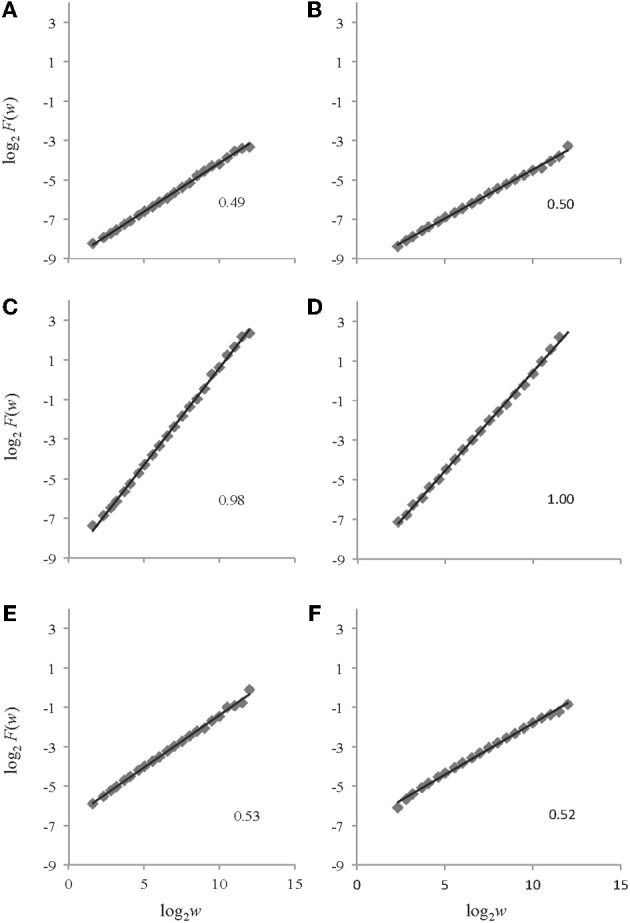
Example log2F(w) vs. log2w plots returned by AFA for the time series depicted in Figure 4. The plots on the left side (panels A, C, and E) are from AFA using a polynomial order of M = 1 while those on the right side (panels B, D, and F) are from AFA using a polynomial order of M = 2. Plots A and B are for white noise, plots C and D are for pink noise, and plots E and F are for brown noise. The respective HfGn (A, B, C, and D) and HfBm (E and F) values are shown for each signal.