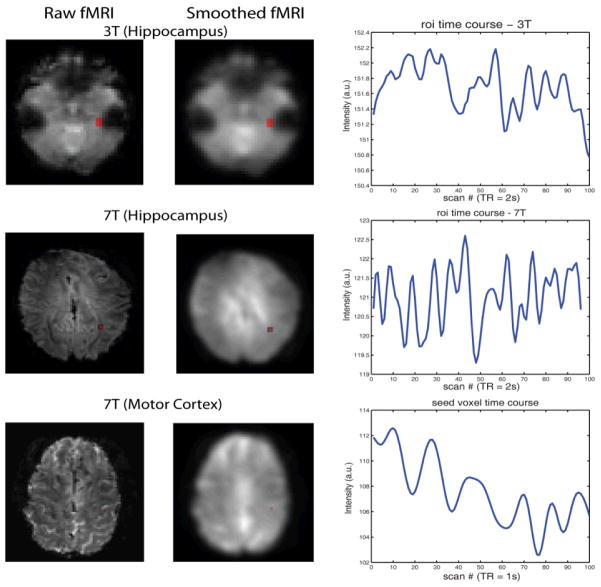
Figure 1.
Presentation of data and seed regions. The first column show one slice raw images with the seed region marked in red for each data set. The second column displays the smoothed images. Note that we analyzed the smoothed images for hippocampus seed region but un-smoothed images for motor cortex seed voxel. The third column plots the average seed region intensity after preprocessed across the first 100 scans.

