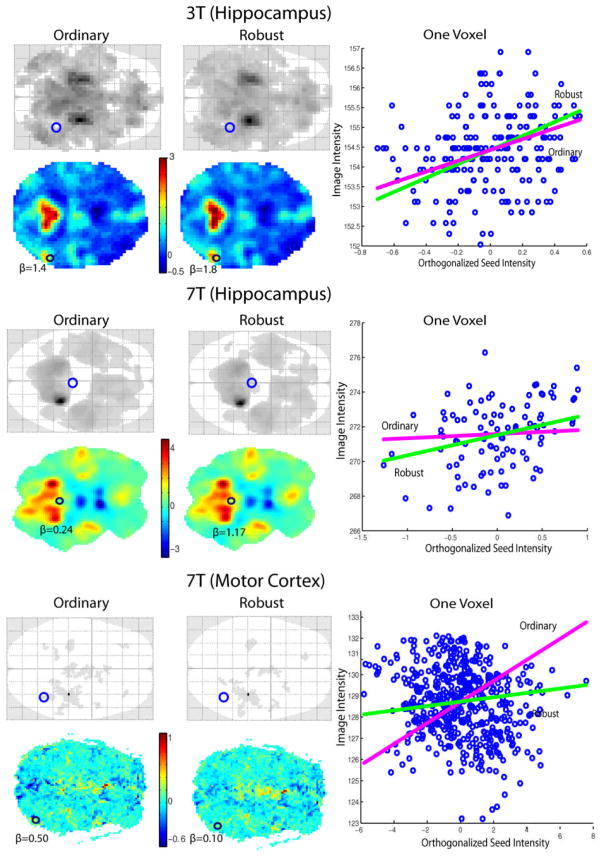
Figure 4.
Comparison of Ordinary and Robust methods. For each data set, the first left row displays one dimension glass brains of the connectivity maps based on corrected FWE p<0.05 and 10 voxels extent threshold to exclude noise. One slice of the estimated parameters for the seed signal from both ordinary and robust methods are shown in the second left row. One voxel inside the regions where the two methods estimated different significance is enlarged in the right column, which is corresponding to the blue circle in the glass brains and the black circle in the β images. The blue dots represent the raw data intensity. The seed intensity regression lines from ordinary and robust methods are plotted ignoring motion confounds.

