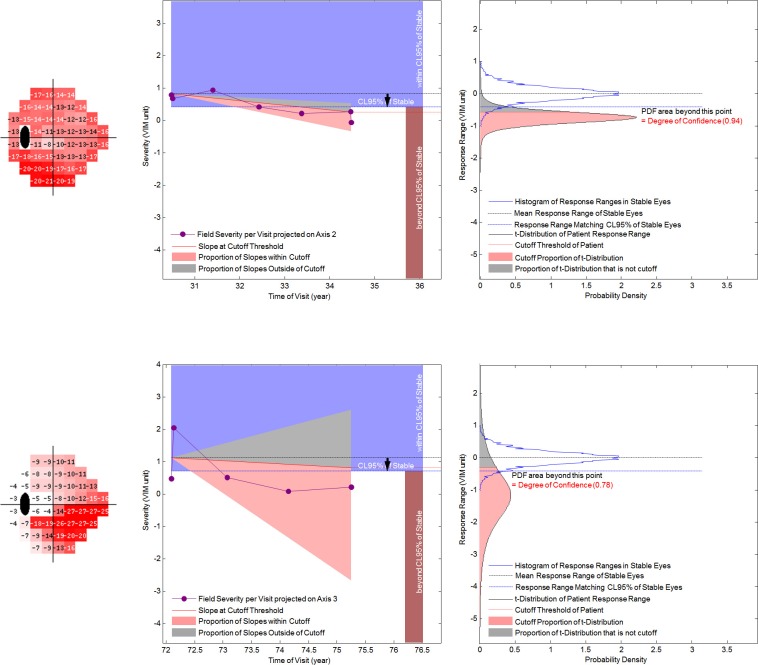
Figure 3. .
Display of the DOC and rate of progression in the axis with the maximal change in severity. The upper panels show an eye with little field variability; the lower panels show an eye with much field variability. The left panels are designed to display information about progression that can be easily assimilated. The right panels are the PDFs that are the basis of the left panels. Far left are gray scale displays of the selected axis. The purple dots and lines are the projected values of a sequence of visits in VIM units. The empirically derived PDF of response ranges in stable eyes is represented as a blue bell shaped histogram in the right panels and a blue rectangle in the left panels. The 95% CL is a blue line in the right panels and the inferior limit of the blue rectangle in the left panels. The t-distribution of the LR slopes of an individual eye's sequence of projected values on an axis is a black bell shaped curve in the right panels. The cutoff proportion is in pink, and the complement is in gray. The triangle in the left panels demonstrates the 95% CI of the slopes, with the cutoff proportion in pink and the complement in gray. The red line is the limit of the cutoff proportion. If the red line crosses the lower edge of the blue rectangle, the eye is classified as progressing (upper panels). If it remains within the blue triangle, the eye is classified as not progressing (lower panels).

