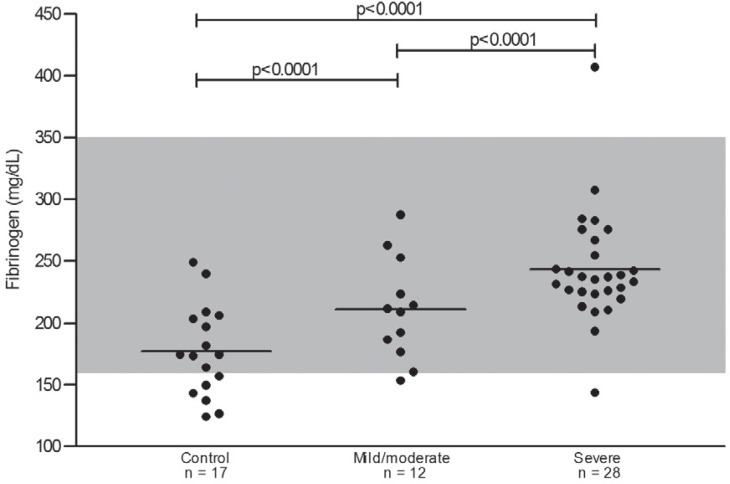
Figure 2.
Distribution of plasma fibrinogen levels in control (angiographically normal arteries), mild/moderate and severe atheromatosis groups. Statistically significant differences were found between the three groups (p-value < 0.05). The shaded area corresponds to the normal range (160 – 350 mg/dL) for fibrinogen levels; horizontal lines represent the mean values of groups.

