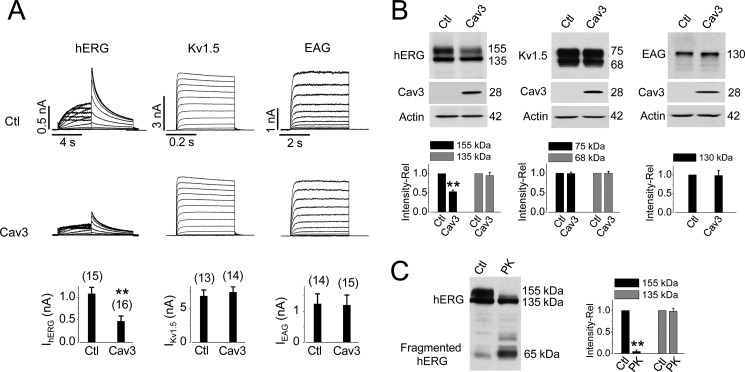
FIGURE 1.
Overexpression of Cav3 reduces the hERG expression at the plasma membrane. A, effects of Cav3 on hERG, Kv1.5, and EAG currents. Representative currents in pcDNA3-transfected (control, Ctl) or Cav3-transfected cells are shown. The current amplitudes under various conditions are shown below the current traces. The numbers in parentheses above each bar indicate the number of cells tested. B, effects of Cav3 on the expression levels of hERG, Kv1.5, and EAG channel proteins. The relative band intensities of various channel proteins in the presence of Cav3 versus those in the absence of Cav3 are summarized beneath the representative Western blot images (n = 8 for hERG, n = 5 for Kv1.5, and n = 4 for EAG). C, hERG 155-kDa band localized on the plasma membrane. The relative intensities of the 155-kDa and 135-kDa band from hERG-HEK cells treated with proteinase K (PK) versus those from control cells are shown. n = 5; **, p < 0.01 versus control (Ctl).

