FIGURE 4.
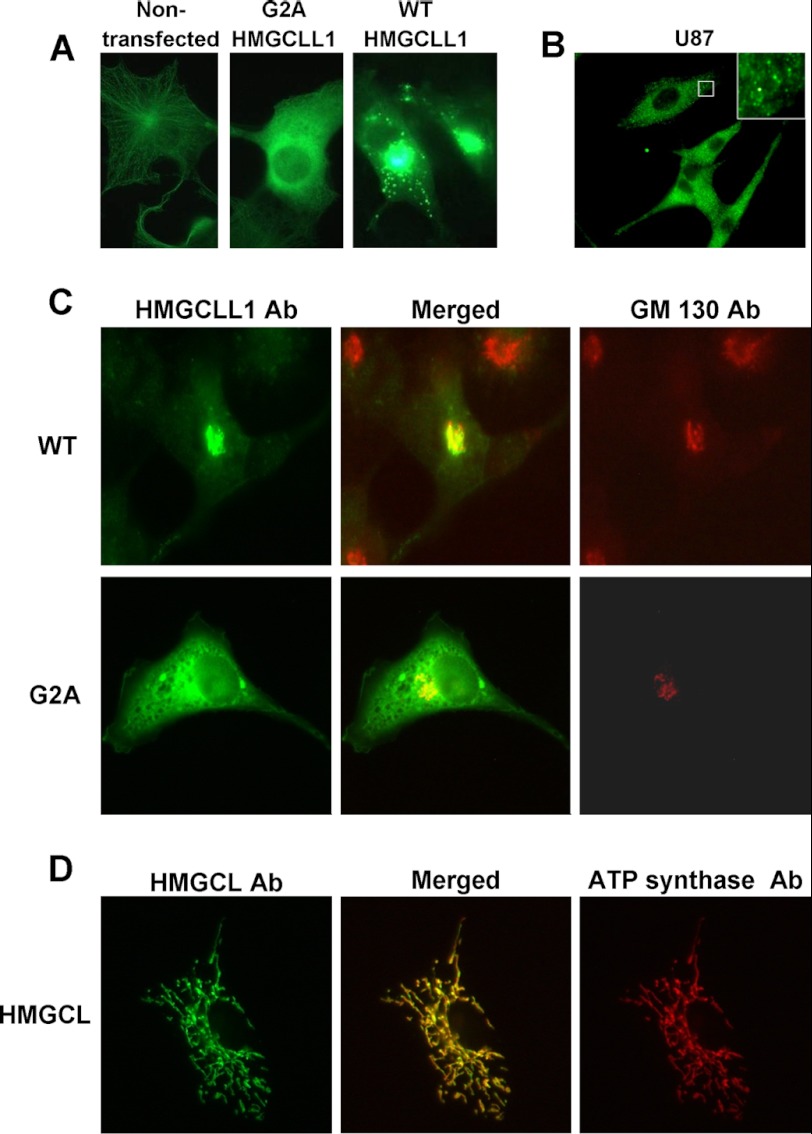
Immunofluorescence microscopy detection of HMGCLL1 in COS-1 and U87 cells. Panel A indicates levels and localization of HMGCLL1 in COS-1 cells that are nontransfected (left) or transfected with expression plasmids encoding G2A HMGCLL1 (center) or wild-type HMGCLL1 (right). Panel B reflects endogenous expression of HMGCLL1 in U87 glioblastoma cells. The inset illustrates HMGCLL1 localization in punctate vesicles. Panel C (top panel) compares COS-1 cell localization of wild-type HMGCLL1 (left) and the Golgi marker protein GM130 (right); the center image results upon merging of the left and right images. The panels in the bottom row depict contrasting localization results when the G2A mutant protein is expressed. Panel D depicts the results of control experiments in which COS-1 cells, transfected with pcDNA3-HMGCL, express the HMGCL precursor. After expression and processing, the mature protein is detected in organelles (left). Upon comparison with localization of an ATP synthase mitochondrial marker protein (right), the mitochondrial localization of mature HMGCL (center; merged image) is confirmed.

