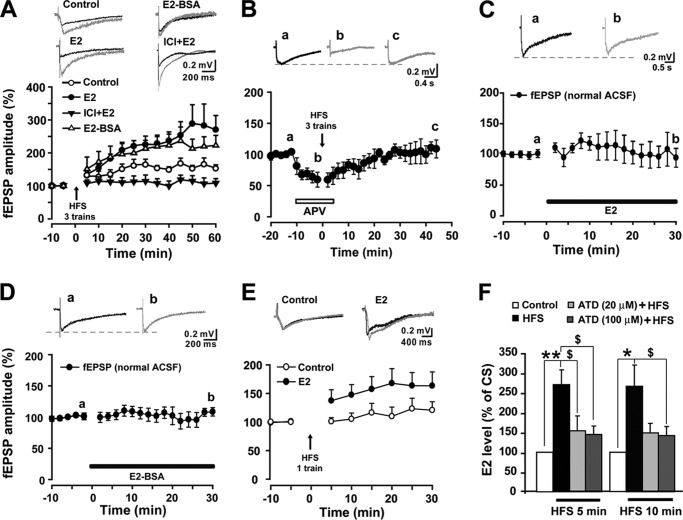
FIGURE 3.
The role of E2 in spinal LTP of fEPSPs. A, three trains of HFS reliably induced LTP of fEPSPs in the spinal dorsal horn (n = 7). E2 (10 μm) raised the amplitude of LTP (n = 5). E2-BSA (10 μm) induced an analogous enhancement of LTP magnitude (n = 5). E2-induced enhancement of LTP was blocked by 1 μm ICI 182,780 (n = 7). Top, traces collected during base-line recording (black line) and 60 min after three trains of HFS (gray lines) in different groups. B, pretreatment with APV (50 μm) completely impaired three-train HFS-induced LTP of fEPSPs (n = 5). Top, representative fEPSPs recorded at the times indicated by the letters. C and D, neither E2 (10 μm) nor E2-BSA (10 μm) affected basal fEPSPs in normal ACSF (n = 4–6). Top panels, representative fEPSPs recorded at the times indicated by the letters. E, one-train HFS (arrows) produced more potentiation following preinfusion with E2 (n = 12) compared with control slices (n = 13). Top, traces collected from slices during base-line recording (black line) and 30 min after delivery of one train of HFS (gray lines). F, E2 levels in the perfusate of spinal slices before and after HFS. E2 levels were significantly elevated at 5 and 10 min after HFS compared with conditioning stimulation. Preincubation of slices in ACSF containing androstatrienedione (ATD 20 and 100 μm) for 30 min significantly attenuated the HFS-induced increase in E2 concentrations. *, p < 0.05; **, p < 0.01 versus controls; $, p < 0.05 versus HFS. Error bars, S.E.

