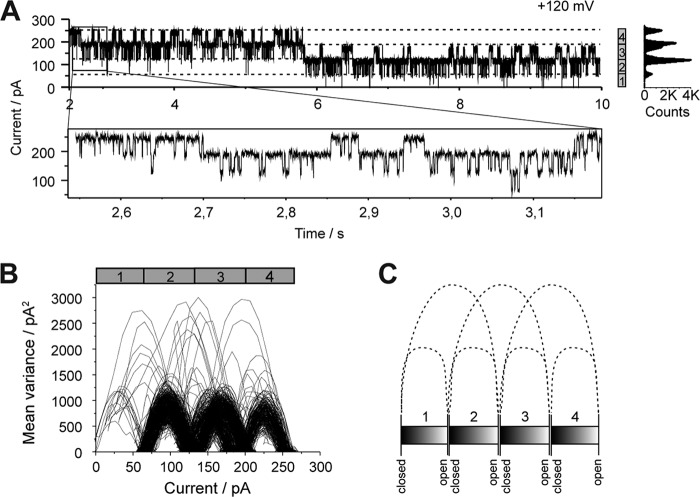
FIGURE 9.
Oxa1 complex gating shows four pores of which two are coupled in each case. A, current recording of an Oxa1 complex containing bilayer at +120 mV. B, mean variance analysis of the current trace depicted in A (zoom plot). C, schematic representation of the gating transitions shown in B. B and C mainly show gating events of the main conductance state (4 to 3, 3 to 2, etc, but also gating events over two main conductance states (i.e. 4 to 2, 3 to 1, and 2 to fully closed) indicating two of the four pores are coupled in each case.

