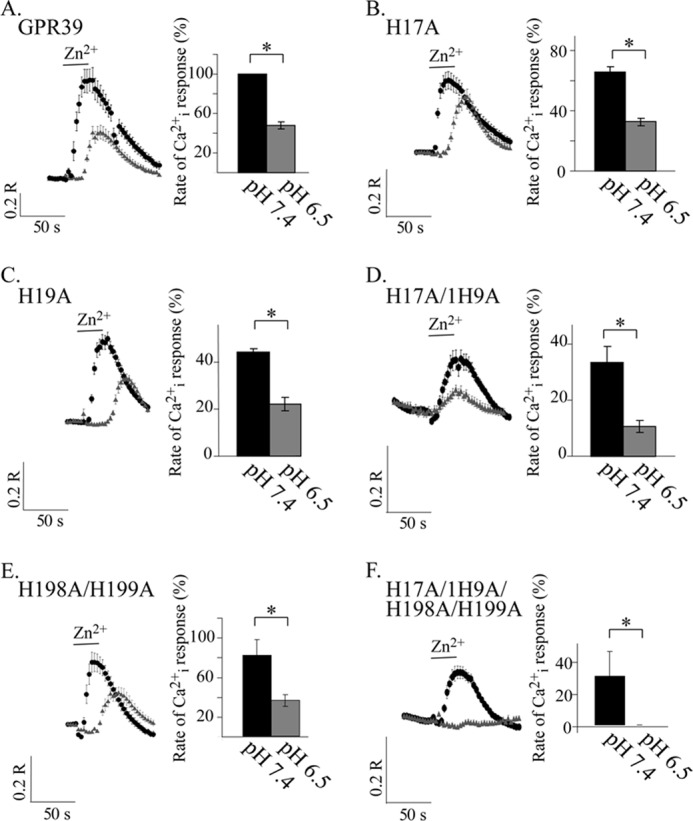
FIGURE 6.

GPR39 His mutants do not lose pH sensitivity, similar to the WT GPR39. A–F, Zn2+ (200 μm)-dependent Ca2+ responses were measured in Fura-2-loaded cells at pH 7.4 (black circles) or 6.5 (gray triangles). The fluorescent signals were measured in HEK293 cells expressing WT GPR39 (A) or the indicated mutants (B–F). Shown are representative fluorescence traces monitored after application of Zn2+ in each of the pH values (left panels) and the average initial rate of the responses (right panels) presented as a percentage of the response triggered by 200 μm Zn2+ applied at pH 7.4 in cells expressing WT GPR39 (n = 5; *, p < 0.05).
