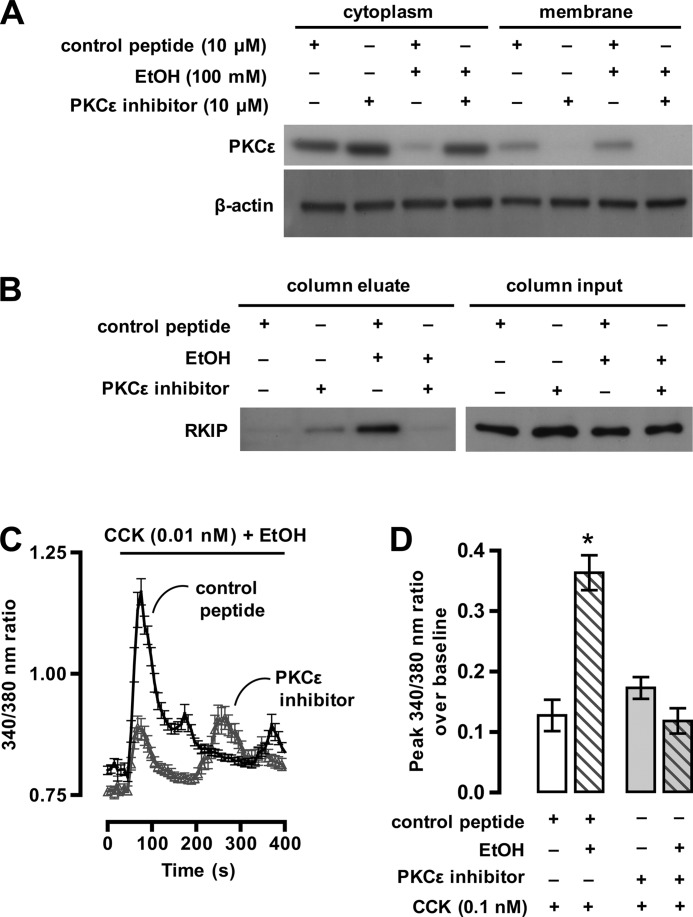
FIGURE 2.
PKCϵ mediates EtOH-induced RKIP phosphorylation and potentiation of CCK-stimulated Ca2+ signaling. A, an immunoblot shows the relative expression levels of PKCϵ in the cytoplasm and membrane fraction of AR42J cells pretreated either with PKCϵ inhibitor peptide or a control peptide and exposure to EtOH (100 mm) for 10 min. The blot was reprobed with an antibody to β-actin to ensure the equal loading and transfer of proteins for each sample. B, an immunoblot shows the effect of PKCϵ inhibition on EtOH-induced RKIP phosphorylation (column eluate; 20 μg of eluted protein per lane). AR42J cells were treated as indicated followed by enrichment of phosphoproteins using affinity resin (“Experimental Procedures”). The level of RKIP expression in each sample was assessed to ensure that an equivalent amount of RKIP protein was loaded on to each column (column input; 2 μg of AR42J cell protein extract per lane). C, a plot of change in the 340/380-nm ratio of Fura-2 fluorescence versus time shows the effects of PKCϵ inhibition on EtOH-induced potentiation of CCK-8-stimulated increase in [Ca2+]cyto. Each tracing is the mean data from 30–40 cells ± S.D. Images were collected every 2–3 s. D, a summary plot of data from three independent experiments shows the effects of PKCϵ inhibition on EtOH-induced (open bars) potentiation of CCK-8-stimulated increase in [Ca2+]cyto. The y axis plots the peak change in the 340/380-nm ratio of Fura-2 fluorescence over base line ± S.E. of the initial Ca2+ peak after CCK-8 stimulation. Statistical analysis was performed using GraphPad Prism 5 software.

