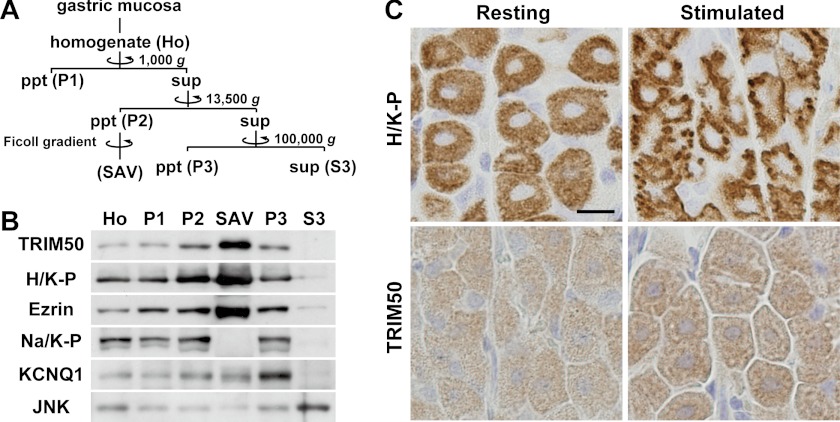
FIGURE 2.
Subcellular localization of TRIM50 in parietal cells. A, flow chart for mouse gastric mucosal cell fractionation by differential centrifugation. Ho, total homogenate of gastric mucosa; P1, precipitates (ppt) after low speed centrifugation (nuclei and cell debris); P2, precipitates after high speed centrifugation (high density microsomal membrane); SAV, stimulation-associated vesicles, fraction prepared from P2 by Ficoll density gradient centrifugation (apical canalicular membrane-rich fraction); P3, precipitates after ultracentrifugation (low density microsomal membrane); S3, supernatant (sup) after the ultracentrifugation (cytosolic fraction). B, preparations (1 or 10 μg opf protein) during the cell fractionation were subjected to Western blot analysis using antibodies specific to TRIM50, H+/K+-ATPase (H/K-P; canalicular and tubulovesicular membrane marker), ezrin (canalicular and tubulovesicular membrane marker), Na+/K+-ATPase (Na/K-P; basolateral membrane marker), KCNQ1 (tubulovesicular membrane marker), and JNK (cytoplasmic kinase). C, immunohistochemical detection of H+/K+-ATPase and TRIM50 in parietal cells during the resting and histamine-stimulated phases. The scale bar indicates 10 μm.

