FIGURE 4.
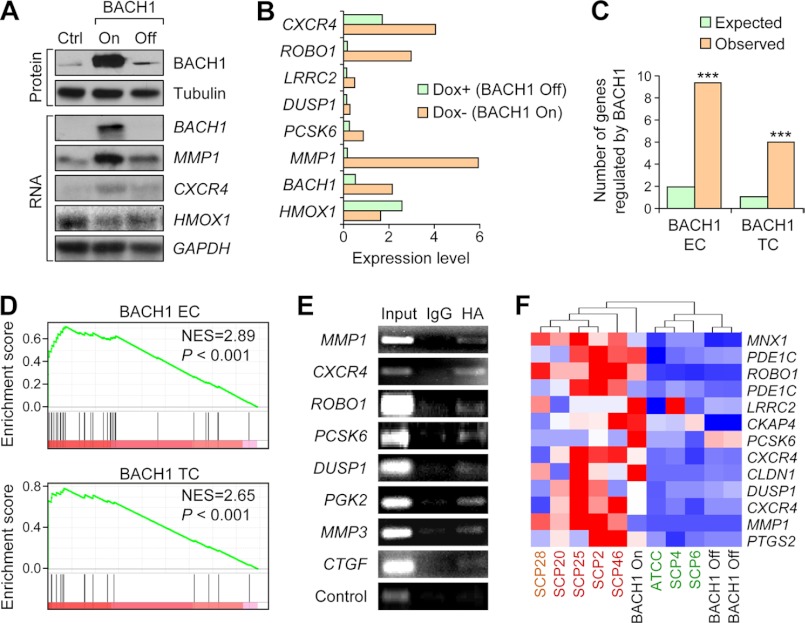
BACH1 module genes were regulated by BACH1. A, Western blot (top) and Northern blot (bottom) analysis of BACH1 and the module genes in SCP4 parental cells and the cells with BACH1 inducible overexpression. B, the mRNA expression levels of BACH1 and the module genes after BACH1 induction. HMOX1 is a gene known to be repressed by BACH1. C, the number of genes regulated by BACH1 in the EC and TC sets. ***, binomial test, p < 0.001. D, GESA of BACH1 EC (top) and TC (bottom) genes after BACH1 induction. The genes were ordered by the expression fold changes after BACH1 induction in descending order from left to right. E, ChIP analysis of BACH1 module genes in HeLa cells with HA-BACH1 overexpression. F, unsupervised clustering analysis of SCP4 with inducible BACH1 overexpression (black) and cells with strong (red), medium (yellow), and weak (green) metastasis tendencies by BACH1-regulated EC genes. NES, normalized enrichment score; Ctrl, control.

