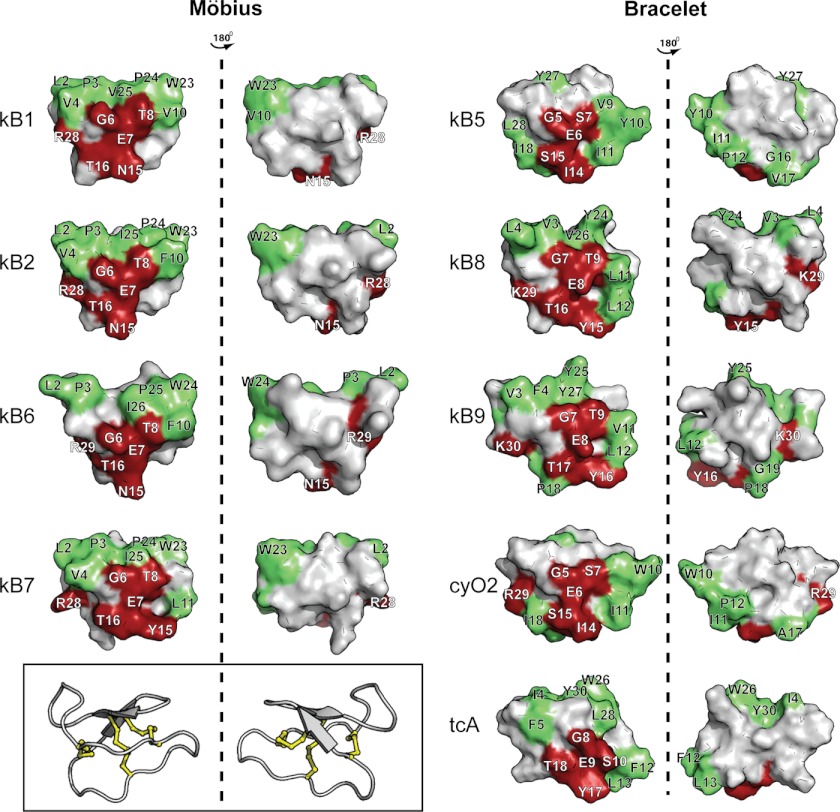
FIGURE 11.
Surface representation of selected cyclotides. Surface representations of the cyclotides included in this study are shown in two views. The “bioactive face” previously identified for kB1 (25, 58) is shown in red, i.e. residues in loop 1 (GET for kB1), the two first residues in loop 3 (NT for kB1), and the Lys/Arg in loop 6. Hydrophobic residues (Ala, Ile, Leu, Met, Phe, Pro, Trp, Val, and Tyr) are shown in green. The three-dimensional structure of kB1 is shown inside the box to define the orientation of the cyclotide surfaces.

