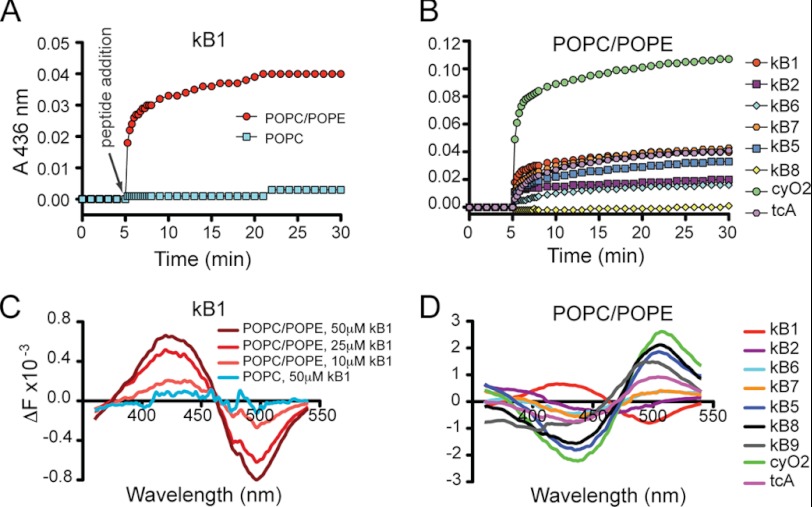
FIGURE 6.
Alterations in membrane properties caused by cyclotides. A and B, vesicle aggregation was followed via absorbance variation at 436 nm; 25 μm peptide was added to lipid vesicles at a lipid concentration of 100 μm. An increase in the absorbance indicates vesicle aggregation. A, absorbance variation of POPC or POPC/POPE (80:20) vesicle suspensions upon addition of kB1. B, comparison of absorbance variation of POPC/POPE (80:20) vesicle suspensions upon addition of tested cyclotides. C and D, changes in membrane dipolar potential can be sensed by the spectral shift obtained in the fluorescence excitation spectra of di-8-ANEPPS dye. The excitation spectrum of di-8-ANEPPS-labeled vesicles (200 μm final lipid concentration containing 4 μm of di-8-ANEPPS dye) was subtracted from the spectrum obtained in the presence of peptide and normalized to integrated areas to reflect the spectral shift. C, di-8-ANEPPS fluorescence difference obtained with POPC/POPE (80:20) or with POPC in the presence of kB1. A blue shift is evident for POPC/POPE (80:20), revealing changes in the membrane dipolar potential, which are more pronounced with increased peptide concentration (i.e. 10 versus 25 versus 50 μm). No change in the dipolar potential of POPC was sensed even with 50 μm kB1. D, fluorescence difference obtained with POPC/POPE (80:20) in the presence of 50 μm tested native cyclotide. A blue shift indicates an increase in the dipolar potential, and a red shift indicates a decrease.

