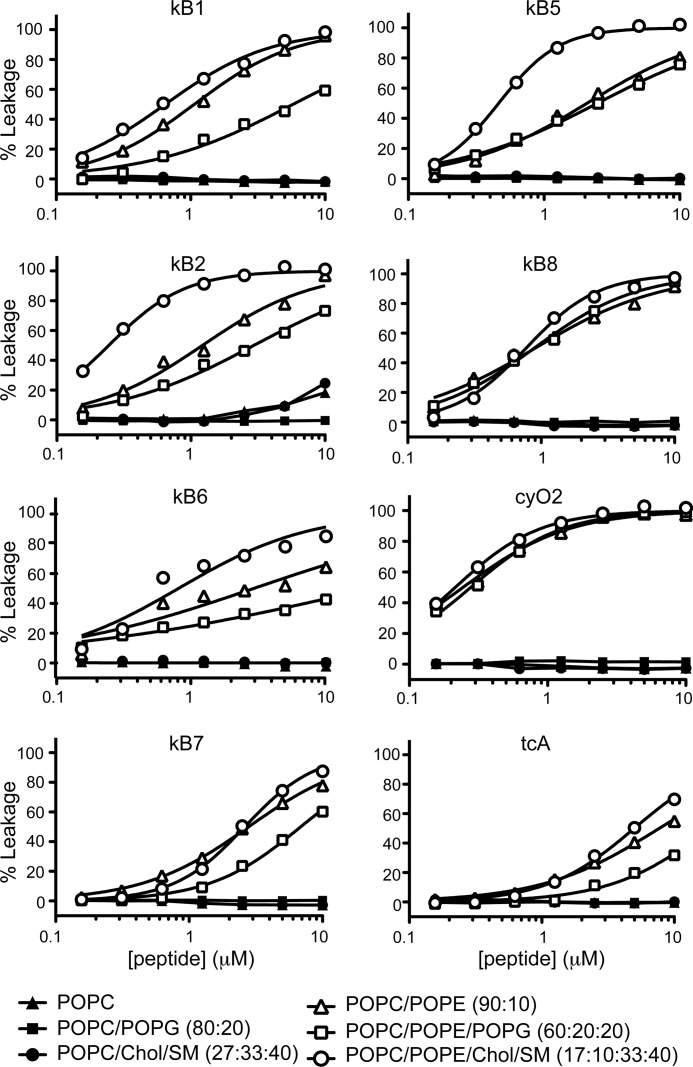
FIGURE 7.
Membrane leakage induced by cyclotides. The percent leakage is plotted as a function of peptide concentration for a set of six cyclotides. The percent leakage was calculated by measuring the fluorescence (λexcitation = 489 nm/λemission = 515 nm) of CF release after a 10-min incubation of the cyclotide with lipid vesicles (5 μm lipid concentration). The leakage from vesicles made with six lipid mixtures is compared. The leakage curves were fitted with a nonlinear regression equation, dose-response binding with variable slope using Graphpad Prism Version 5.0d. LC50 values are given in Table 3.

