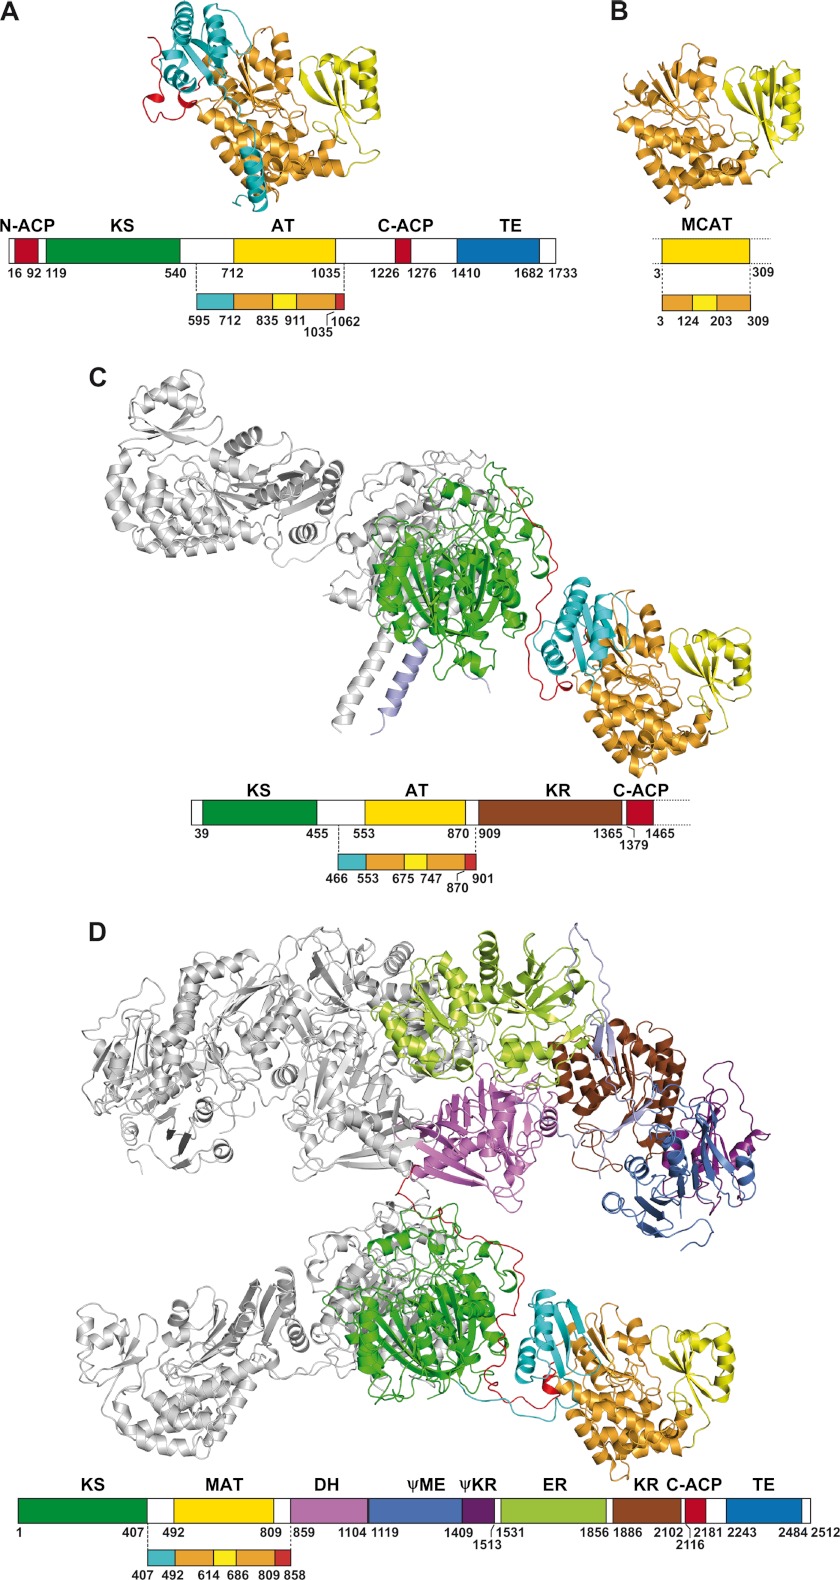
FIGURE 3.
Comparison of known structures comprising AT, MCAT, and MAT domains. A, AT52 of Pks13 from M. tuberculosis. B, E. coli MCAT (Protein Data Bank code 2G2Z). C, KS-AT didomain of module 5 from DEBS (Protein Data Bank code 2HG4). D, mammalian FAS-I (Protein Data Bank code 2VZ8). The structures are shown such that the AT domains are in the same orientation. The domains and linkers are color-coded as follows: α/β-hydrolase and ferredoxin-like subdomains, orange and yellow, respectively; KS-AT linkers, cyan; post-AT linkers, red; KS, green; dehydratase (DH), violet; pseudo-methyltransferase (ΨME), blue; pseudo-ketoreductase (ΨKR), magenta; enoyl reductase (ER), lime green; ketoreductase (KR), brown. The second chains of the KS-AT didomain of module 5 from DEBS and mammalian FAS dimers are in light gray.

