FIGURE 6.
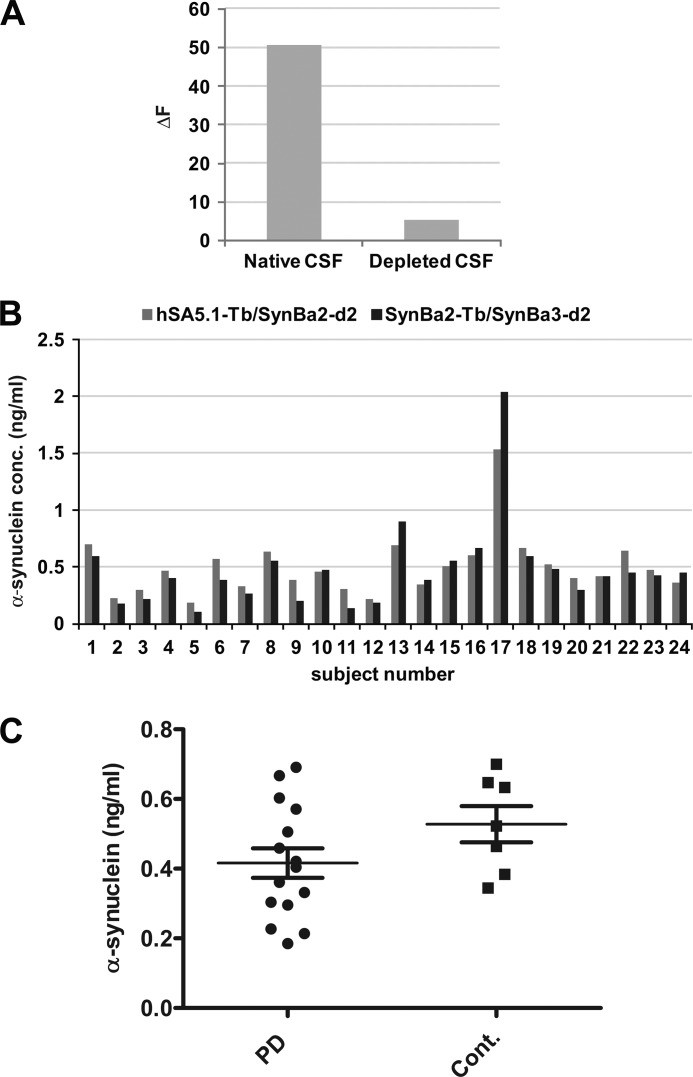
TR-FRET quantification of α-synuclein in human CSF. A, establishment of immunodepleted CSF for use as a calibration matrix is shown. Human CSF was subjected to immunoprecipitation of α-synuclein by incubation for 1.5 h with hSA5.1 antibody followed by two rounds of capture with protein G beads. Subsequent TR-FRET analysis was with SynBa2-TB/SynBa3-d2. B, shown is quantification of α-synuclein content in the CSF of donors from various collections by two TR-FRET antibody pairs. C, shown is comparison of α-synuclein concentrations in PD and healthy control patient CSF. Data are presented as individual sample values (means of replicates) with group means (±S.E.) indicated.

