FIGURE 1.
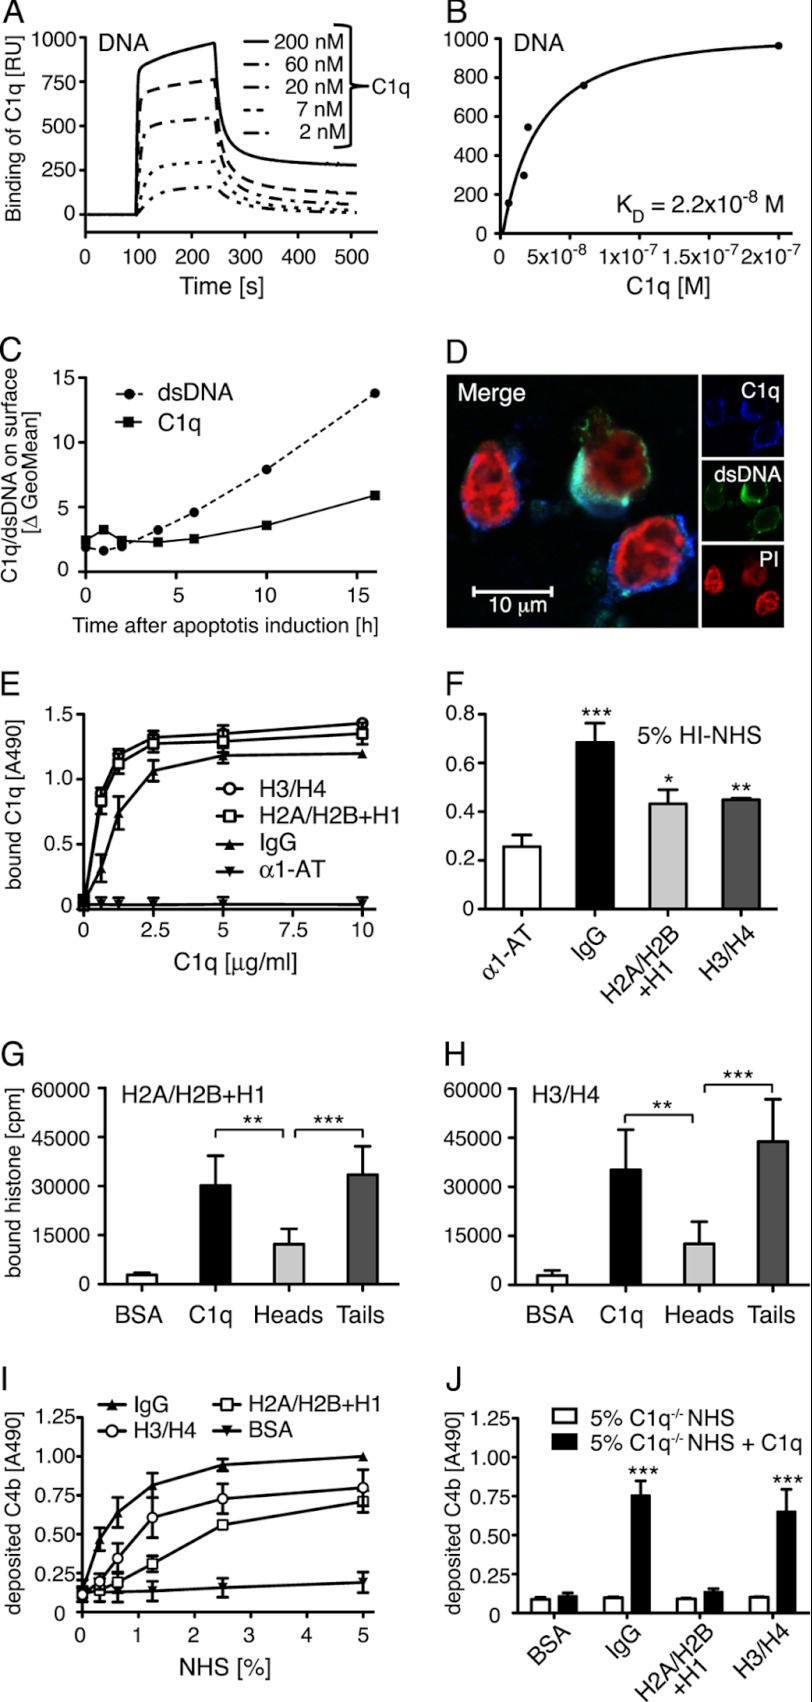
C1q binds DNA and histones. A, increasing concentrations of C1q were flown over immobilized biotinylated DNA on a plasmon surface resonance (Biacore) streptavidin chip. Dose-dependent binding of C1q to DNA was observed and is presented in arbitrary response units (RU). B, the response obtained at equilibrium was plotted against C1q concentration and KD value of the C1q DNA interaction was determined to 2.2 × 10⁻⁸ m. C, by flow cytometry, double-stranded DNA expression and C1q binding (50 μg/ml) on apoptotic cells were investigated after the indicated time of apoptosis induction. An increase of expression of dsDNA as well as binding of C1q was seen during the course of apoptosis although the increase was more pronounced for dsDNA than the C1q binding. D, localization of C1q (blue), dsDNA (green), and propidium iodide (PI) (red) on apoptotic cells was analyzed using confocal microscopy. E, binding of C1q to immobilized histones, IgG (positive control), and α1-AT (negative control) was analyzed in an ELISA setup. Clear concentration dependent binding was seen for C1q to both histone complexes. F, binding of C1q from Hi-NHS to immobilized histones or IgG was detected and compared with α1-AT as a control. G and H, radiolabeled histone H2A/H2B + H1 and H3/H4 were incubated with immobilized C1q, C1q globular heads, C1q collagenous tails, and BSA (negative control). After washing, the amount of bound protein was determined in a γ-counter. Binding occurs mainly to the collagenous tail region. I and J, C4b deposition on immobilized histones or controls was measured from NHS (I), C1q-deficient sera or C1q-deficient sera reconstituted with 70 μg/ml of C1q (J). Deposition of C4b was detected on all histone complexes from NHS and it decreased in C1q-deficient sera but could only be restored upon addition of C1q to the H3/H4 histone complex. For C, representative values from two independent experiments are shown. For D, one representative image of two independent experiments is shown. E-H, values are shown as mean of duplicates, n = 4 (G and H) and n = 3 (E and F, I and J) ± S.D. Significance of differences was calculated using one-way analysis of variance followed by Tukey's (G and H) or Dunnett's (F and J) multiple comparison post-test and is displayed as: *, p < 0.05; **, p < 0.01; ***, p < 0.001.

