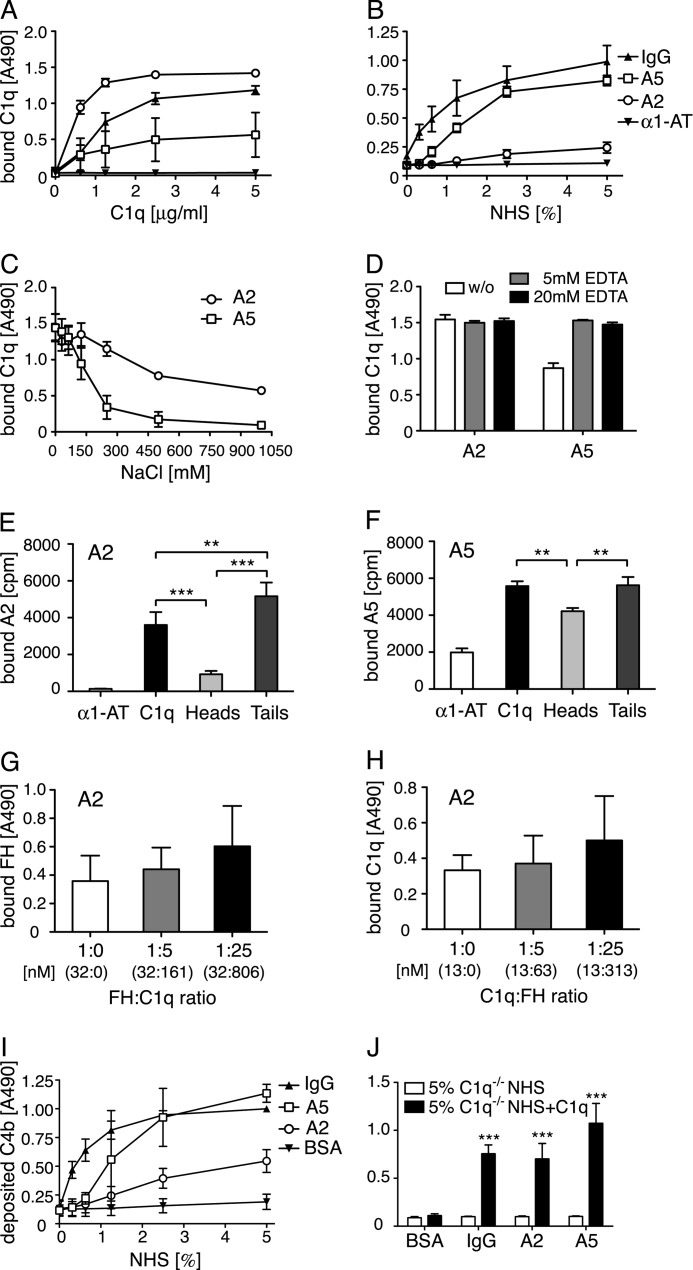
FIGURE 2.
Annexin A2 and A5 bind C1q and activate complement. A and B, increasing concentrations of C1q were incubated with immobilized annexin A2, annexin A5, IgG (positive control), or α1-AT (negative control). Clear binding to both annexins was seen both by purified protein (A) and NHS (B). C and D, C1q (10 μg/ml) diluted in buffers with increasing ionic strength or containing 5 or 20 mm EDTA was added to immobilized annexins. The interaction of C1q with both annexin A2 and annexin A5 decreased with increasing ionic strength (C) but was not dependent on bivalent cations (D). E and F, radiolabeled annexin A2 and A5 were incubated with immobilized C1q, C1q globular heads, C1q collagenous tails, and α1-AT (negative control). After washing, the amount of bound protein was determined in a γ-counter. The annexins bound well to the collagenous tail region of C1q and annexin A5 also bound strongly to the globular head domain of C1q. G and H, binding of C1q (6.25 μg/ml) to annexin A2 was competed with FH (G) and reverse (5 μg/ml and FH, H). The actual concentration of each protein is depicted in nanomolar in parentheses. No competition was observed in either setting. I and J, C4b deposition was measured on annexins or controls from NHS (I), C1q-deficient sera or C1q-deficient sera reconstituted with 70 μg/ml of C1q (J). Clear deposition was seen from NHS, which was completely abolished in C1q-deficient sera and could be restored upon addition of C1q. Values are shown as mean of duplicates, n = 3 (E, n = 4) ± S.D. E–H, significance of differences was calculated using one-way analysis of variance followed by Tukey's multiple comparisons post-test and is displayed as: *, p < 0.05; **, p < 0.01; ***, p < 0.001. For J, the significance of differences was calculated using two-way analysis of variance with a Bonferroni post-test and is displayed as: ***, p < 0.001.

