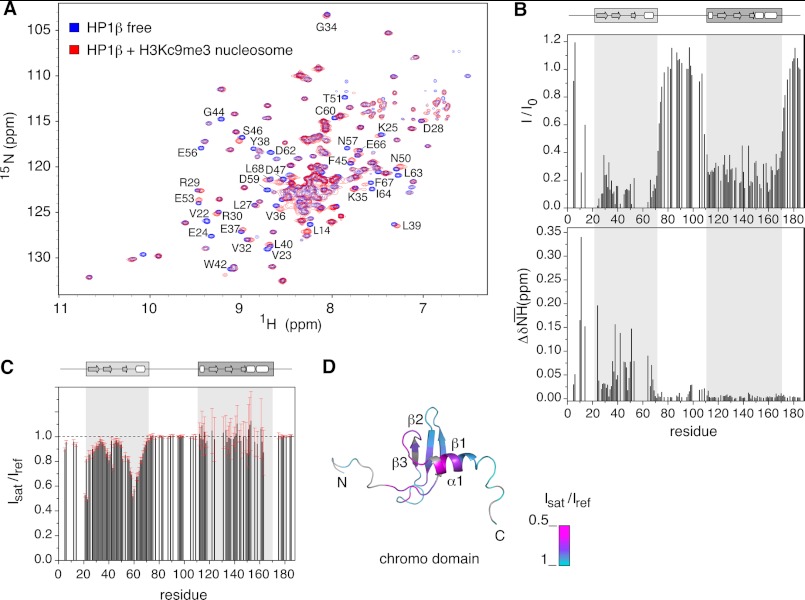
FIGURE 2.
Molecular determinants of hHP1β binding to H3KC9me3 nucleosome defined by NMR spectroscopy. A, two-dimensional TROSY-1H,15N HSQC spectra of hHP1β alone (blue) and with H3KC9me3 nucleosome at a molar ratio of 1:2 (red). Residues experiencing large changes are annotated. B, intensity loss (I/I0) and weighted chemical shift difference (ΔδNH) values from the spectra in A are plotted as a function of hHP1β primary sequence. A cluster of signals (Val-22 to Val-23, Lys-43 to Gly-44, and Glu-55 to Asp-62) disappeared already at low molar ratio. Other missing values correspond to proline residues or residues with severe signal overlap. The domain organization of hHP1β is schematically shown at the top. C, nucleosome-to-hHP1β cross-saturation transfer experiments: intensity ratio of hHP1β signals recorded with (Isat) or without (Iref) selective saturation of nucleosome aliphatic protons. Error bars were calculated on the basis of the signal-to-noise-ratios in the two spectra. Missing signals are due to severe overlap, and some residues (i.e. 164–173) broadened beyond detection below 290 K (supplemental Fig. 2). D, intensity ratio values representing the success of cross-saturation transfer via direct binding are mapped onto the three-dimensional structure of the chromodomain (Protein Data Bank code 1AP0 (6)). Residues without experimental values (proline or overlapped) are in gray.

