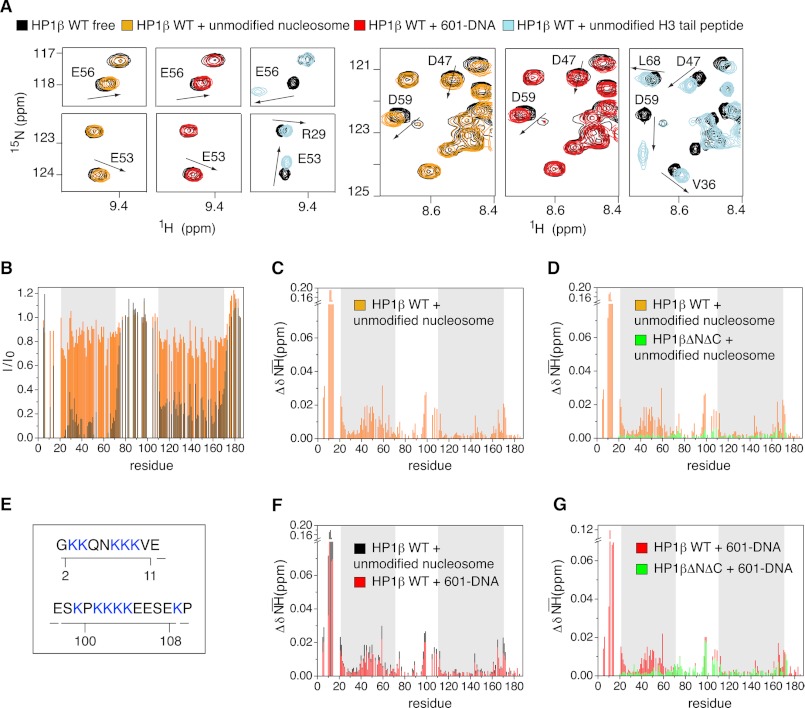
FIGURE 5.
Interaction interfaces of hHP1β with unmodified and H3KC9me3 nucleosome are different. A, selected regions of the TROSY 1H,15N HSQC spectrum of free hHP1β (black) and of hHP1β in the presence of unmodified nucleosome (orange), free 601-DNA (red), or unmodified H3-tail peptide (light blue). In all three cases, the hHP1β/ligand molar ratio was 1:1. Arrows highlight the direction of peak shifts for some residues in the CD. B, hHP1β-1H,15N resonance intensity loss upon binding to unmodified nucleosome (orange) and H3KC9me3 nucleosome (black) as a function of residue number. The hHP1β/ligand molar ratio was 1:2 in both cases. C, chemical shift changes (ΔδNH) upon hHP1β binding to unmodified nucleosome. D, comparison of chemical shift changes (ΔδNH) in WT hHP1β (orange) and hHP1βΔNΔC (green) in the presence of unmodified nucleosome, both at 1:1 molar ratio. E, lysine patches in the hHP1β N-terminal and hinge region (see also supplemental Fig. 5F). F, comparison of chemical shift changes induced in WT hHP1β upon binding to free 601-DNA (red) and unmodified nucleosome (black), both at 1:1 molar ratio. G, 1H,15N chemical shift changes in WT hHP1β (red) and hHP1βΔNΔC (green) in the presence of 601-DNA at molar ratios of 1:1.

