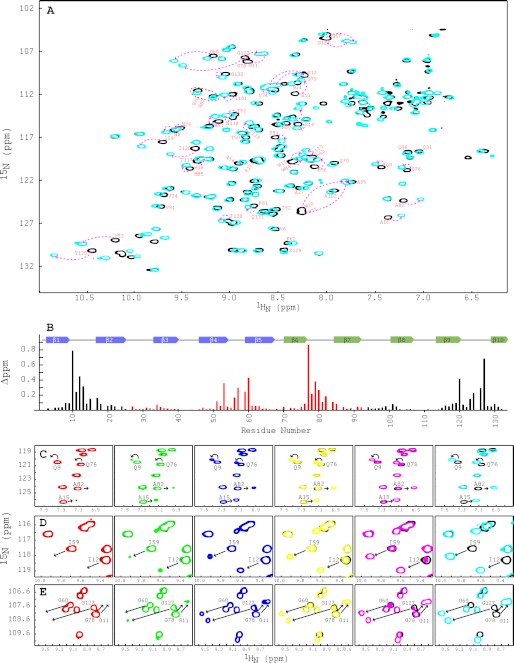
FIGURE 3.
NMR titrations of PFA with α3,α6-mannopentaose. A, superposition of the two-dimensional 1H-15N HSQC spectra of free (black) and α3,α6-mannopentaose-bound (cyan) PFA at 1:3 molar ratio of PFA to sugar. Selected resonances that exhibit large chemical shift changes are labeled by amino acid type and number. Note that the amide resonances of Gly26 and Gly93 are significantly upfield shifted in their proton frequencies and not within the current spectral boundaries. B, secondary structure and chemical shift perturbation profile of combined amide chemical shift changes for PFA at the final titration point (PFA:α3,α6-mannopentaose = 1:3). Values were calculated using the equation; Δppm = ((Δppm (1HN))2 + (Δppm (15N)/5)2)1/2. C–E, superposition of selected regions in the two-dimensional 1H-15N HSQC spectra of free (black) and α3,α6-mannopentaose bound PFA at 1:0.25 (red), 1:0.50 (green), 1:1 (blue), 1:1.5 (yellow), 1:2 (magenta), and 1:3 (cyan) molar ratios of PFA to sugar for residues Ala15/Ala82 and Gln9/Gln76 (C), residues Ile59/Ile126 (D), and residues Gly60/Gly127 and Gly11/Gly78 (E). All spectra are plotted at the same contour level, and all titrations were carried out using 0.040 mm PFA in 20 mm sodium acetate, 20 mm NaCl, 3 mm NaN3, 90/10% H2O/D2O (pH 5.0), 25 °C.

