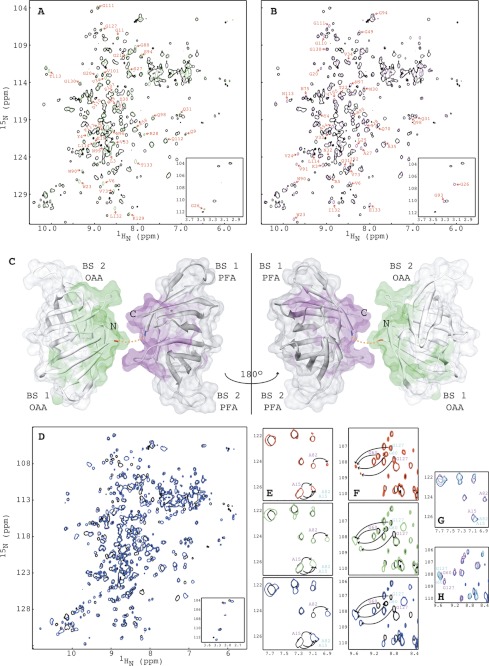
FIGURE 8.
Comparison of the structures and NMR titrations of OPA with α3,α6-mannopentaose by 1H-15N HSQC spectroscopy. A and B, superposition of the two-dimensional 1H-15N HSQC spectra of OPA (black) and OAA (green) (A) and of OPA (black) and PFA (magenta) (B). Residues of OAA and PFA that exhibit small chemical shift changes are labeled by amino acid type and number. The four amide resonances of the OPA glycines that correspond to Gly26 and Gly93 in OAA or PFA are shown in the bottom inset. C, structural mapping of OAA and PFA residues that exhibit chemical shift differences between the two proteins. The C-terminal residue of OAA and the N-terminal residue of PFA are colored in red and blue, respectively. The short two-residue linker connecting OAA and PFA is depicted by a dashed orange line. D, superposition of the two-dimensional 1H-15N HSQC spectra of free (black) and α3,α6-mannopentaose bound (blue) OPA at molar ratio of OPA to α3,α6-mannopentaose of 1:4. E and F, superposition of selected regions of the two-dimensional 1H-15N HSQC spectra of free (black) and α3,α6-mannopentaose bound OPA at 1:1 (red), 1:2 (green), and 1:4 (blue) molar ratios of OPA to sugar for residues Ala15/Ala82 (E; cyan) and residues Gly60/Gly127 (F; magenta). G and H, superposition of selected regions of the two-dimensional 1H-15N HSQC spectra of OAA (cyan), PFA (magenta) and OPA (blue) at the final titration point. All spectra are plotted at the same contour level, and all titrations were carried out using 0.100 mm OPA in 20 mm sodium acetate, 20 mm NaCl, 3 mm NaN3, 90/10% H2O/D2O (pH 5.0), 25 °C.

