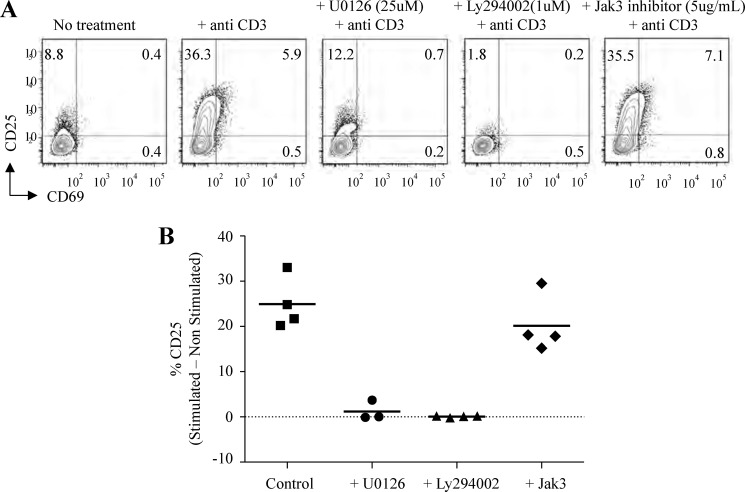
FIGURE 4.
Analysis of pre-TCR signaling pathways in IL-7Rαhi Molt3 using specific kinase inhibitors. A, analysis of pre-TCR activation markers in IL-7Rαhi Molt3 after overnight activation and inhibitor treatment as indicated. B, percentage of CD25 expression in inhibitor-treated versus control anti-CD3 antibody-stimulated cells after subtraction of the non-stimulated control. Data represent at least three independent experiments.

