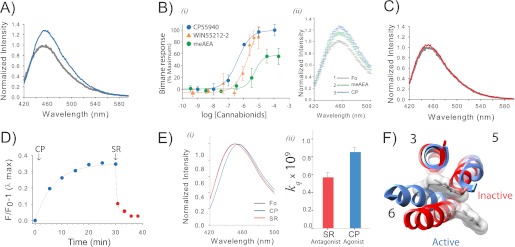
FIGURE 2.
Agonist binding to CB1 induces a conformational change that is detected by a probe at site 6.34 (or 342) on TM6. A, the addition of agonist CP55940 (CP) causes an ∼35% increase in fluorescence intensity for PDT-bimane-labeled mutant sample A342C/θ. The spectra, normalized to the apo state (gray) in Purification Buffer, show before and after a 30-min incubation with 10 μm CP55940 (blue). B, i, the dose-response plot of the agonists (CP55940, WIN55212-2, and meAEA) report the stimulated increase in fluorescence (data normalized to the maximum increase in fluorescence for CP55940). The apparent EC50 are 430 ± 86 nm for CP55940, 3 ± 0.4 μm for WIN, and 6.6 ± 4.0 μm for meAEA. The bimane dose-response plots are the means of at least three independent experiments fit with a sigmoidal dose response function. ii, the partial increase in fluorescence induced by meAEA addition (50 μm, green) is further increased by subsequent addition of CP55940 (CP, 35 μm, blue). Each data point in the spectra shows the range of the S.E. from three independent experiments. Fo, ligand-free receptor. C, in contrast to agonists, adding antagonist (5 μm SR141716A, red) has essentially no effect on the fluorescence when compared with the ligand-free receptor (gray). D, the agonist-induced increase in fluorescence (10 μm CP55940, (CP) blue) occurs slowly, whereas subsequent addition of antagonist (5 μm SR141716A (SR), red) causes a rapid reversal. E, agonist binding induces the probe to move into a more polar, solvent-accessible environment, as indicated by the shift in the λmax of the normalized emission spectra (blue, 10 μm CP55940; red, 5 μm SR141716A; gray, absence of ligands) (i) and a comparison of the bimolecular quenching constants (kq) determined from the Stern-Volmer quenching experiments (ii). Error estimates come from the least squares fitting. F, a movement of the probe on A342C into a more polar environment is consistent with the presumed location of the probe in CB1 models based on rhodopsin in the inactive state (red, Protein Data Bank (PDB): 1GZM) and active state (blue, PDB: 3DQB). For clarity, the figure only shows the probe and TM3, TM5, and TM6. See “Experimental Procedures” for more details. Error bars indicate S.E. unless otherwise noted.

