FIGURE 4.
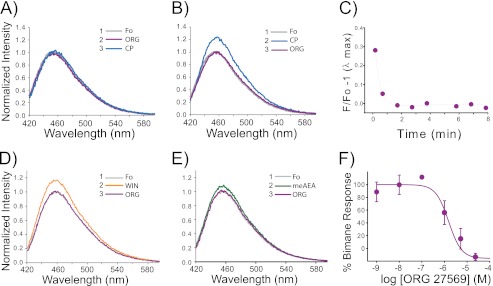
The allosteric modulator Org 27569 inhibits agonist-induced TM6 movement in CB1 detected by a fluorescent probe on site 342. The order in which indicated drugs were added is denoted by the number and compound (inset). Fo represents the ligand-free or apo state (gray) in Purification Buffer. A, Org 27569 (ORG) impairs TM6 movements in CB1. When Org 27569 is preincubated with the bimane-labeled CB1 mutant A342C/θ (10 μm, purple) for 30 min before adding agonist (10 μm CP55940 (CP), blue), the agonist-induced fluorescence change for the bimane probe on TM6 (blue) is no longer observed. B, Org 27569 can also reverse agonist-induced TM6 movements. Adding Org 27569 (10 μm, purple) after agonist (10 μm CP55940) reverses the fluorescence increase in the bimane-labeled CB1 A342C/θ mutant (blue). C, the Org 27569 induced reversal seen in B is rapid, with a t½ < 1 min. Org 267569 (5 μm) also reverses the fluorescence increase caused by CB1 agonists (the figure is an example of data collected from one sample in real time). D and E, WIN55212-2 (WIN, 10 μm, 30 min) (D) and meAEA (38 μm, 30 min) (E). F, the dose-response plot for Org 27569 inhibition of agonist (CP55940)-induced TM6 movement (stimulated increase in fluorescence, EC50 = 2.2 ± 1.2 μm) can be compared with the dose response for Org 27569 enhancement of agonist CP55940 binding (shown in Fig. 3D). The bimane dose-response plot represents the mean of two independent experiments ± range. The EC50 values were determined by fitting a variable slope sigmoidal dose-response function to the combined respective data sets, and errors were determined from least squares fitting. All spectra are background-subtracted from buffer and ligands and are normalized to the background-subtracted emission for the bimane-labeled mutant CB1 in the apo form (Fo, gray). For comparison, the data for the Org 27569 enhancement of fluorescence was normalized to the maximum increase in fluorescence. Further details are provided under “Experimental Procedures.”

