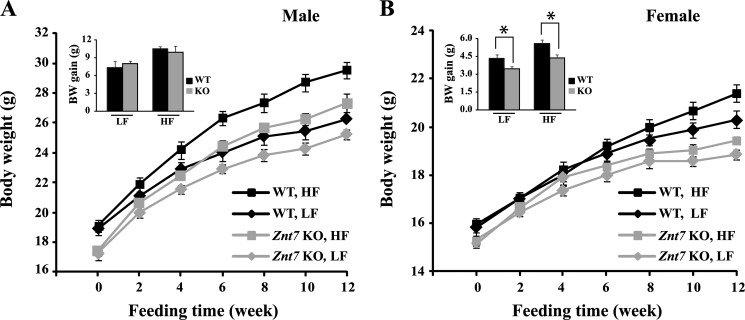
FIGURE 6.
Growth curves and body weight gains of Znt7 KO and control mice fed either the low or high fat diet. A, male; B, female. Mice were fed either a low or a high fat diet at 5 weeks of age for 12 weeks, and body weights were measured at the indicated time points after mice were fed the special diet. All values are expressed as mean ± S.E. (error bars), n = 9–13/group. The insets are summaries of the total body weight gains of male and female Znt7 KO and control mice after 12-week feeding of the indicated diet. Values are mean ± S.E., n = 9–13/group. *, p < 0.05. BW, body weight; WT, C57Bl/6 mice; KO, Znt7 knock-out mice.

