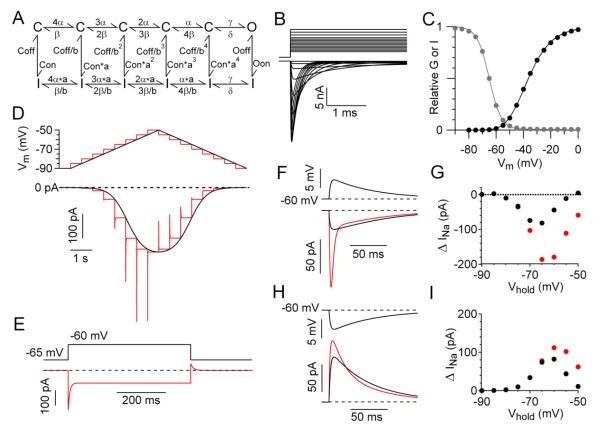
Figure 7. Characteristics of steady-state and transient subthreshold sodium current are predicted in an allosteric model of sodium channel gating.
(A) Model of sodium channel gating. Activation occurs with voltage-dependent transitions between multiple closed states (top row) with strongly voltage-dependent rate constants (α=250*exp(V/24) msec−1, β=12*exp(−V/24) msec−1), considered to correspond to movement of S4 gating regions, followed by a non-voltage-dependent opening transition (γ=250 msec−1, δ= 60 msec−1). Inactivation corresponds to vertical transitions. Inactivation is slow and weak when channels have not activated (Con=0.01 msec−1, Coff=2 msec−1) and becomes faster and more complete in a manner allosterically linked to the extent of activation. The allosteric relationship is expressed by the scaling constants a (2.51) and b (5.32). Inactivation from the open state is fast (Oon=8 msec−1 and with a slow off-rate (Ooff=0.05 msec−1) such that open state inactivation is ~99.4% complete. Microscopic reversibility is ensured by the reciprocal allosteric relationship between activation and inactivation rates for steps corresponding to movement of S4 regions.
(B) Predicted transient currents elicited by steps from a holding potential of −90 mV to a series of voltages from −60 to 0 mV. C) Voltage-dependence of activation (filled circles, relative peak conductance during a 30-msec step) and steady-state availability (open circles). Relative peak conductance was normalized to peak conductance for a step to +30 mV and is fit (black line) by a Boltzmann function raised to the 4th power, (1/(1+exp(−(V+54.1))/10.7)^4. Steady-state availability is fit (gray line) by a first-order Boltzmann function curve, (1/(1+exp(V+65)/4.3).
(D) Predictions of the model for 10 mV/s ramp (black trace) and 5-mV staircase (red trace) voltage protocols. (E) Predictions of the model for sodium current elicited by a 500 ms step from −65 mV to −60 mV and back to −65 mV. Dashed line corresponds to steady-state current at −65 mV (−121 pA). (F) Predictions of the model for activation by an EPSP waveform of transient plus steady-state sodium current (red trace) compared to steady-state current alone (black), calculated from the predicted steady-state current at each voltage. (G) Peak steady-state (black symbols) and total (red symbols) sodium current predicted by the model in response to 5-mV EPSP waveforms delivered from a range of holding potentials. (H) Predictions of the model for activation by an IPSP waveform of transient plus steady-state sodium current (red trace) compared to steady-state current alone (black). (I) Peak steady-state (black symbols) and total (red symbols) sodium current predicted by the model in response to IPSP waveforms delivered from a range of holding potentials.

