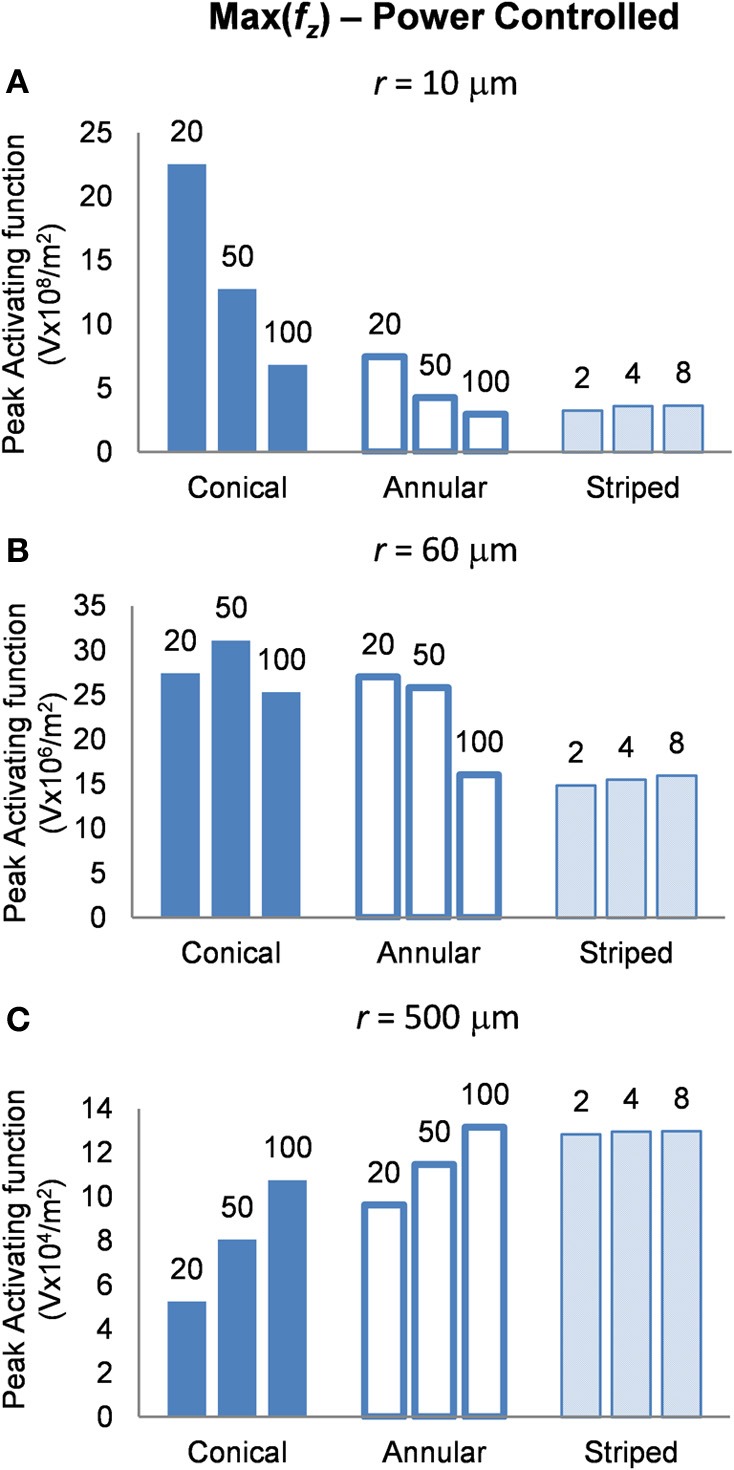
Figure 8.

Maximum values of the activating function as calculated along a line parallel to the electrode surface, shown in Figure 2, when the electrode is supplied with 1 μW at distances (A) r = 10 μm (B) r = 60 μm and (C) r = 500 μm. Note change in y-axis between (A), (B), and (C).
