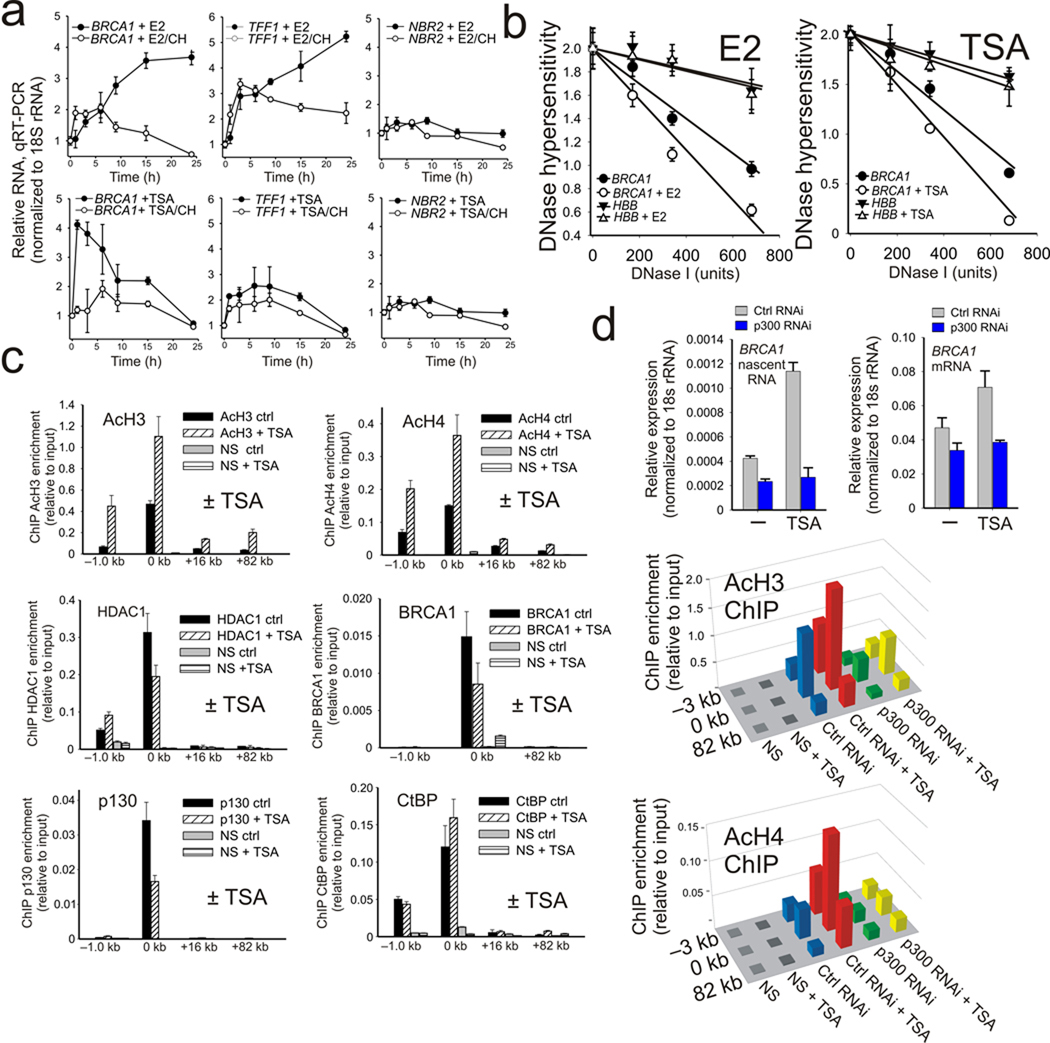
Figure 5.
TSA mimics estrogen induced activation of BRCA1 by increasing p300 dependent histone acetylation at the BRCA1 promoter. (a) Time course of TFF1, NBR2, and BRCA1 expression in MCF-7 cells treated 0–24 h with either E2, E2 + cycloheximide (10 µg ml−1), TSA (500 ng ml−1), or TSA + cycloheximide as indicated. Error bars represent the s.e.m. for N=2 independent biological replicates. (b) DNase I hypersensitivity profile of the BRCA1 promoter and an (HBB) locus control from MCF-7 cells treated with either estrogen or TSA. The error bars represent the s.e.m. for N=3 biological replicates. (c) Acetylated histone H3, acetylated histone H4, HDAC1, BRCA1, p130, and CtBP ChIP profiles at the BRCA1 promoter in control or MCF-7 cells treated 1 h with 500 ng ml−1 TSA. Error bars represent the s.e.m. for N=2 biological replicates. (d) Upper panel: TSA stimulated expression of BRCA1 nascent and mature RNA levels in either control or p300 depleted MCF-7. Error bars represent the s.e.m. for N=2 biological replicates. Lower panel: ChIP enrichment for H3 and H4 histone acetylation at the BRCA1 locus in control versus p300 depleted MCF-7 cells with or without TSA stimulation. Means from N=2 independent biological replicates are shown.

