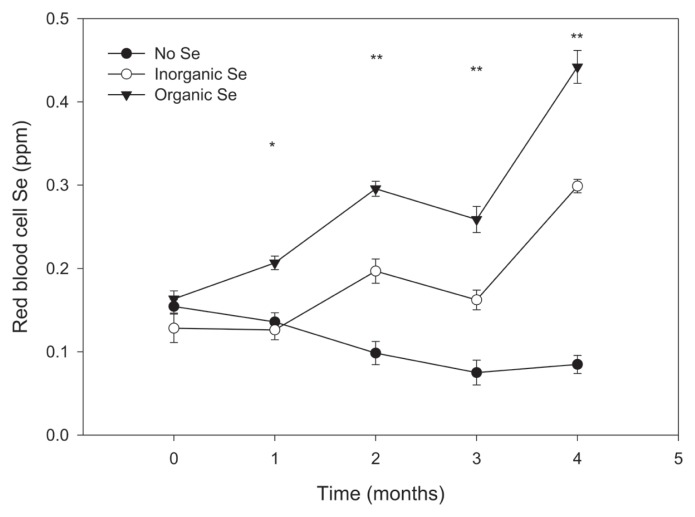
Figure 2.
Mean (± SE) red blood cell Se concentration in adult horses (n = 5 per group) receiving supplementary inorganic Se (0.3 ppm DM, as sodium selenite), organic Se (0.3 ppm DM, as Se yeast), or receiving no supplementary Se (< 0.05 ppm DM); * the mean of horses receiving organic Se is significantly different from the mean of the horses receiving inorganic or no Se (P < 0.05); ** all pairwise mean comparisons are significant (P < 0.05).

