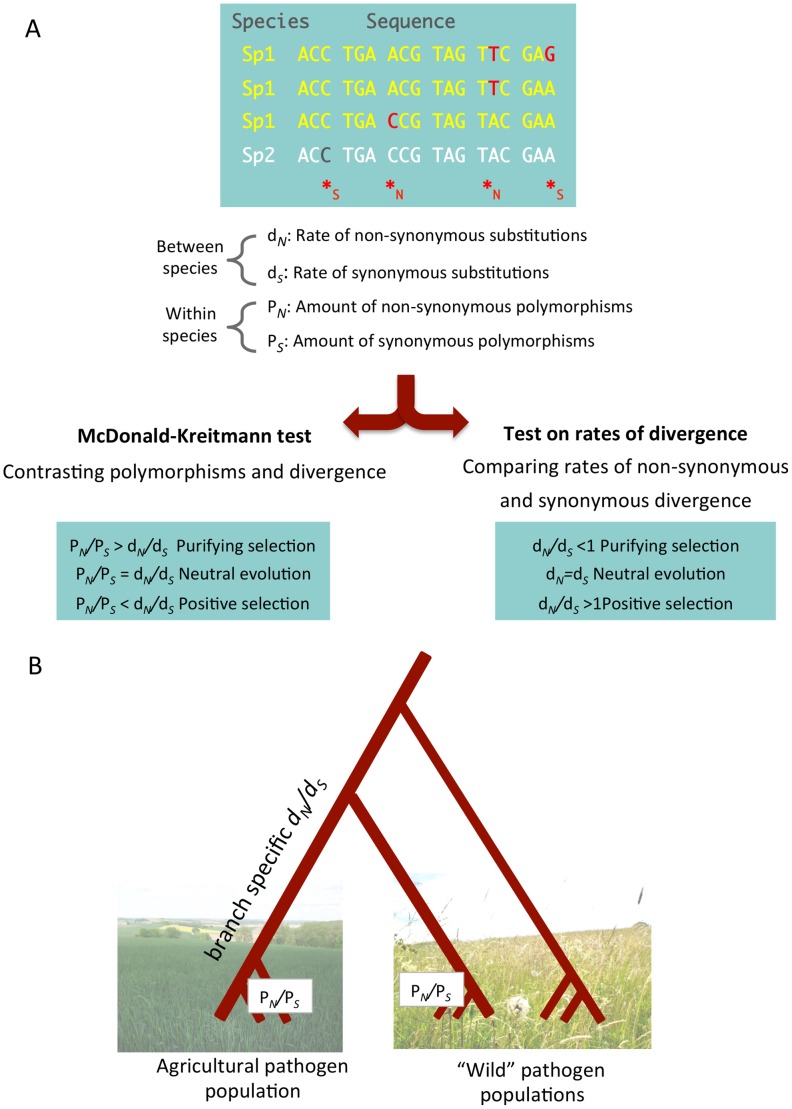
Figure 1. A population genomic approach allows the identification of synonymous and non-synonymous polymorphisms and substitutions.
Based on these parameters, amounts of adaptive evolution and the strength of purifying selection can be quantified. (A) A multi-species (between species) and multi-genotype (within species) alignment. Nucleotide positions can be categorized as either synonymous (*S) or non-synonymous (*N). Comparison of sequences from distinct species allows the detection of sites that have undergone substitutions, while the comparison of individuals of the same species allows the detection of non-synonymous (PN) and synonymous (PS) polymorphisms. While PN and PS reflect present time nucleotide variation in a species, the two rates of divergence dN and dS inform on types of selection during the past divergence of the species. Contrasting the rates of polymorphism and divergence (using a McDonald-Kreitmann-based test [24]) provides a finer grained picture of ongoing levels of purifying selection. (B) During the divergence of a new pathogen species in an agricultural environment, non-synonymous and synonymous substitutions have accumulated in the genome. A branch-specific model [28] can infer rates of non-synonymous and synonymous substitutions as dN and dS. The dN/dS ratio provides insight into the amount of fixed substitutions since the species divergence. An increased dN/dS ratio reflects either a relaxation of purifying selection (accumulation of slightly deleterious mutations) or the fixation of adaptive mutations. To assess the strength of purifying selection we can compare ratios of non-synonymous to synonymous polymorphisms (PN/PS). A comparison of PN/PS ratios between populations can illustrate differences in evolutionary rates under different environmental conditions. Pictures are courtesy of Julien Dutheil.

