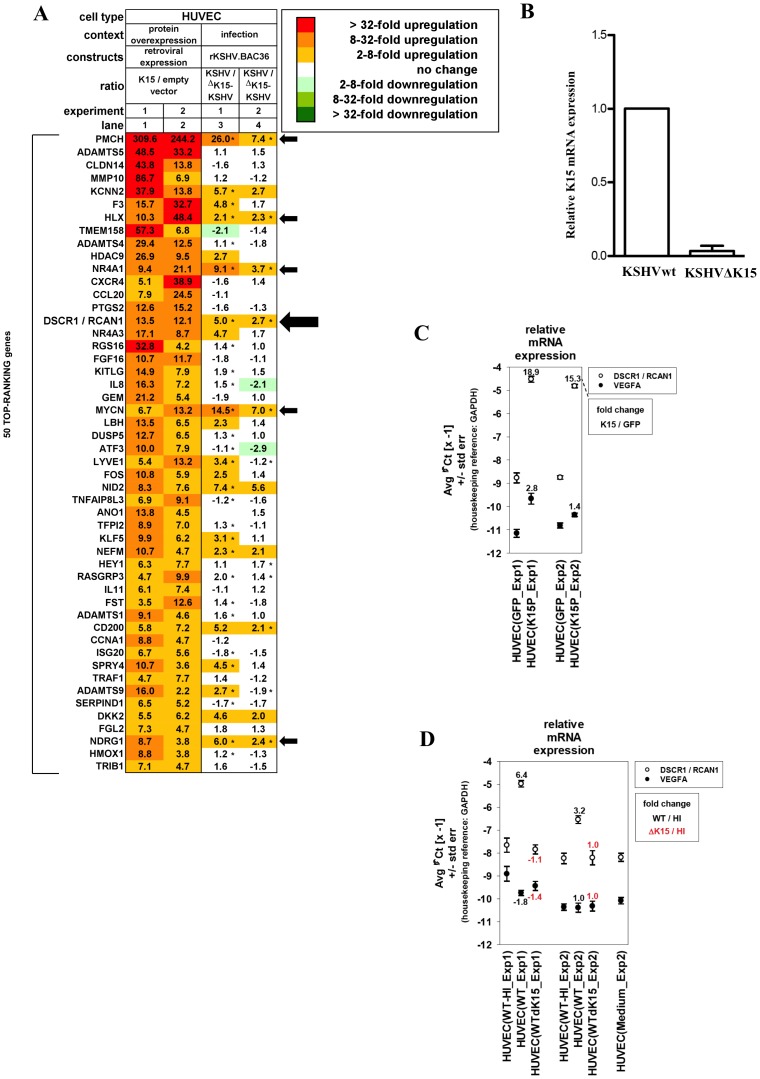
Figure 1. K15 dependent cellular gene expression in HUVECs.
(A) Microarray analysis of cellular mRNAs upregulated in HUVECs by K15 overexpression or after KSHV infection. HUVECs were transduced with a K15-expression vector (lanes 1–2) or infected with either KSHVwt or KSHVΔK15 (lanes 3–4). Depicted are the top-ranking 50 transcripts most strongly upregulated by K15 overexpression, showing an at least two-fold induction by K15 overexpression in each of two experiments performed using cells from two healthy donors (lanes 1–2). Asterisks next to fold change values within heatmap lanes 3–4 indicate genes that were induced more than two-fold in KSHVwt-infected cells compared to cells mock infected with heat-inactivated virus. Empty cells in the heatmap correspond to undetectable mRNA levels in both of the two samples compared in each lane. Arrows indicate cellular genes, inducible upon KSHVwt infection with more than two-fold elevated expression in KSHVwt- relative to KSHVΔK15-infected cells in each of the two experiments performed. (B) Quantitative PCR analysis of K15 transcript in mRNA derived from KSHVwt- or KSHVΔK15-infected cells used for the microarray experiment. (C) Quantitative PCR analysis of RCAN1/DSCR1 and VEGFA transcripts in HUVECs transduced with a retroviral K15 expression vector or with an empty control vector. (D) HUVECs from two healthy donors (Exp1–2) were infected with heat-inactivated, KSHVwt, or KSHVΔK15 and were lysed 4 days after infection. RNA was extracted, reversely transcribed and subjected to quantitative TaqMan-based PCR analysis. mRNA fold change values of KSHVwt-infected versus mock-infected (with heat-inactivated KSHVwt = HI) cells were depicted in black, values of KSHVΔK15- infected versus mock-infected cells were depicted in red. Input mRNA samples are identical to samples used in microarray experiments (compare panel A lanes 3–4).

