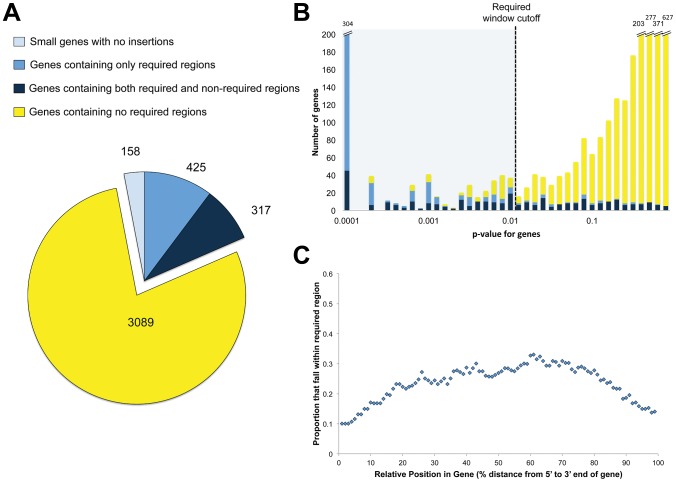
Figure 3. Domain discovery.
A. Genes categorized by domain-level resolution of regional requirement. B. Genes categorized as containing only required regions (blue), containing both required and non-required regions (navy) and containing no required regions (yellow) were assessed for requirement along the entire length of the gene, creating a single p-value describing the statistical underrepresentation of insertion reads within the whole gene. For each category, the number of genes across the range of p-values are plotted. C. For genes with both required and non-required regions, the likelihood that the relative position within the gene resides in a required region.

