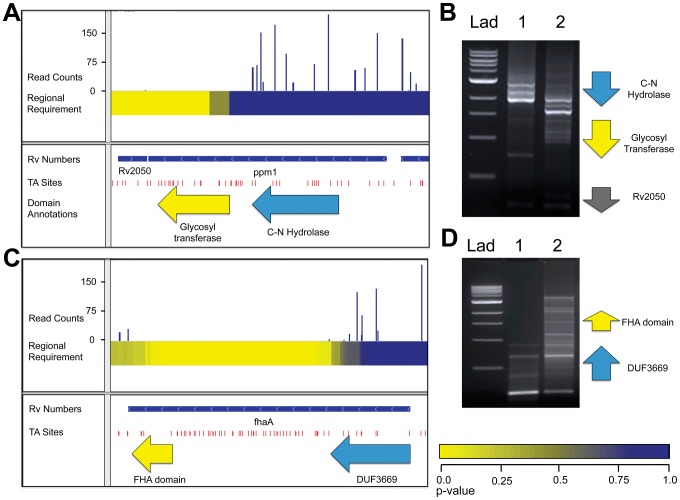
Figure 4. ppm1 and fhaA each code for two domains with varying requirements for growth.
A. IGV plot for genomic region containing ppm1. Tracks, from top to bottom: 1. Histogram of insertion counts, 2. Comprehensive heat-map of requirement of 500-bp windows, 3. Position of annotated genes, 4. TA sites, 5. Position of known domains within ppm1. B. PCR footprinting for insertions was performed using primers against the an upstream genomic region and the transposon end, resulting in amplicons spanning ppm1 to various inserted transposons. Lad: 1 kb DNA ladder, 1: wt Mtb transposon library, 2: ppm1-complemented Mtb transposon library. C. IGV plot for genomic region containing ppm1. Tracks, from top to bottom: 1. Histogram of insertion counts, 2. Comprehensive heat-map of requirement of 500-bp windows, 3. Position of annotated genes, 4. TA sites. D. PCR footprinting for insertions was performed using primers against the an upstream genomic region and the transposon end, resulting in amplicons spanning fhaA to various inserted transposons. Lad: 1 kb DNA ladder, 1: wt Mtb transposon library, 2: fhaA-complemented Mtb transposon library.

