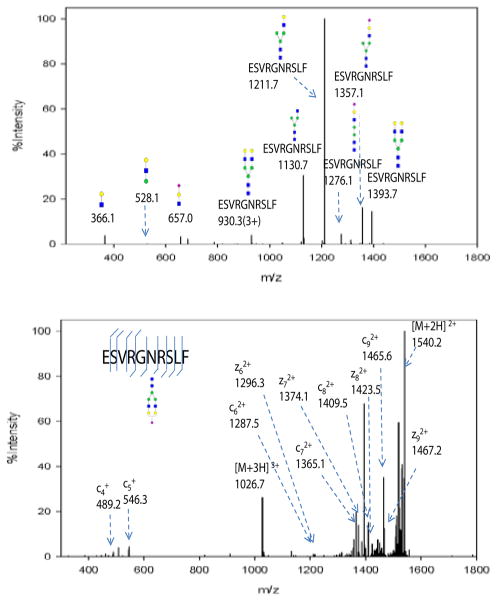
Figure 4.
(a) CID MS/MS spectrum of the glycopeptide at m/z 1026.7 (sequence ESVRGNRSLF). Glycosidic bond cleavages were observed, resulting in b,y type ions. The low mass range was dominated by oxonium ions at m/z 366, 528 and 657. The high mass range was dominated by glycopeptides with partial glycan loss and was used to infer glycan composition. (b) ETD MS/MS spectrum of the same glycopeptide. c,z type ions were observed with the intact glycan structure. Peptide sequence and glycosylation site information were obtained from this spectra.

