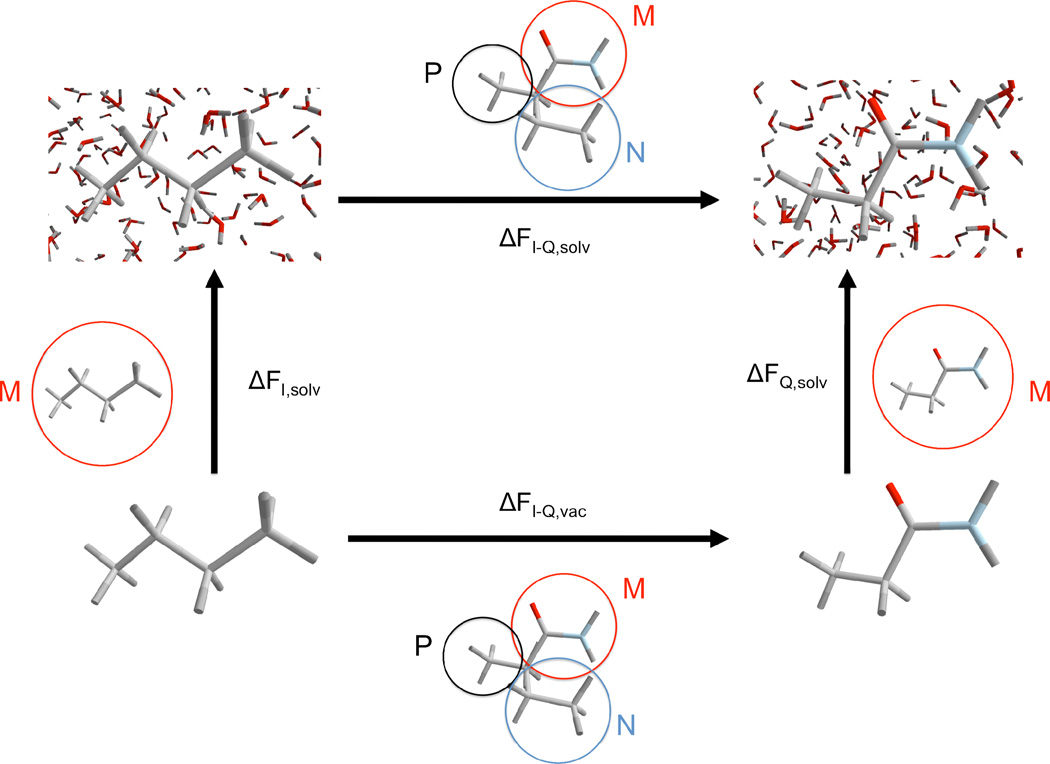
Fig. 2.
The thermodynamic cycle that we used in our calculations. The horizontal arrows represent free energy differences upon mutation of the solute (ILE side chain analog and GLN side chain analog). The vertical arrows represent the solvation process, i.e. the solute is brought from vacuum into solution. For each free energy calculation the colored circles highlight which atoms are considered “P” (black), “N” (blue) or “M” (red).

