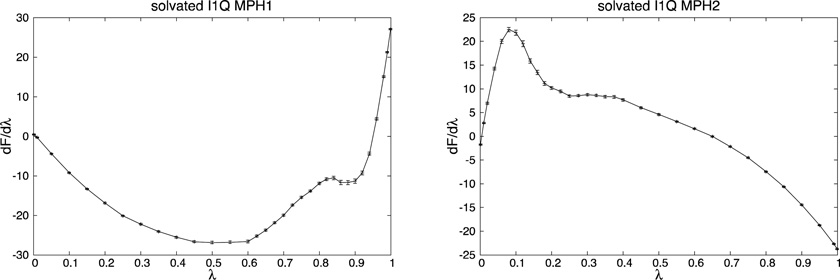
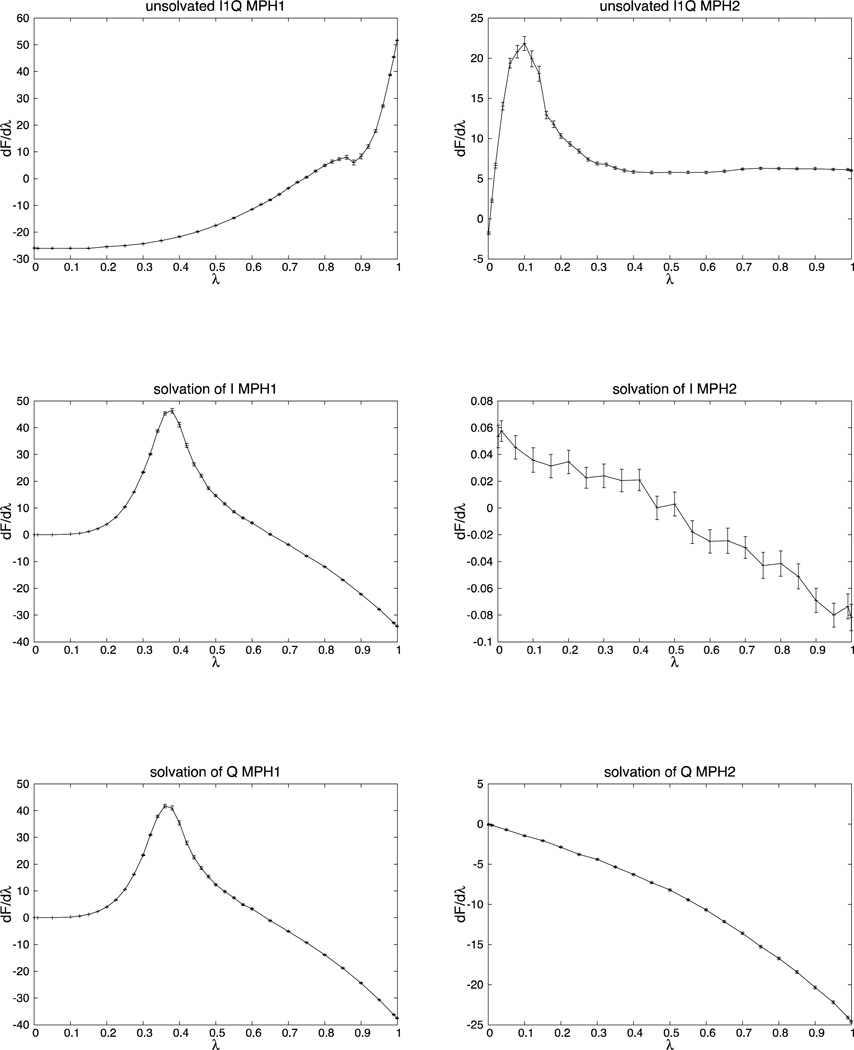
Fig. 5.
dF/dλ profiles (in kcal/mol) as a function of λ of the phases MPH1 and MPH2 of the free energy differences of each part of the cycle of Fig. 2. On the left the MPH1 phase is reported, and on the right the MPH2. From top to bottom we have: mutation from ILE to GLN in solution, mutation from ILE to GLN in vacuum, solvation of ILE and solvation of GLN. The error bars are shown in all figures.


