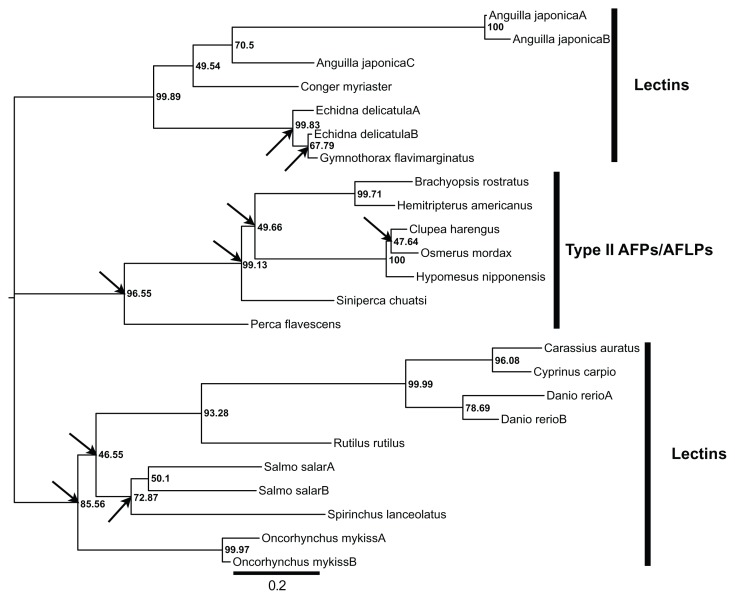
Figure 2.
An unrooted maximum likelihood tree of the type II AFP/AFLPs and lectins.
Notes: The incongruent nodes (ie, bipartitions) between the gene and species trees are indicated by arrows. The values next to the nodes are LR-ELW edge supports. The scale bar shows the number of substitutions per nucleotide.

