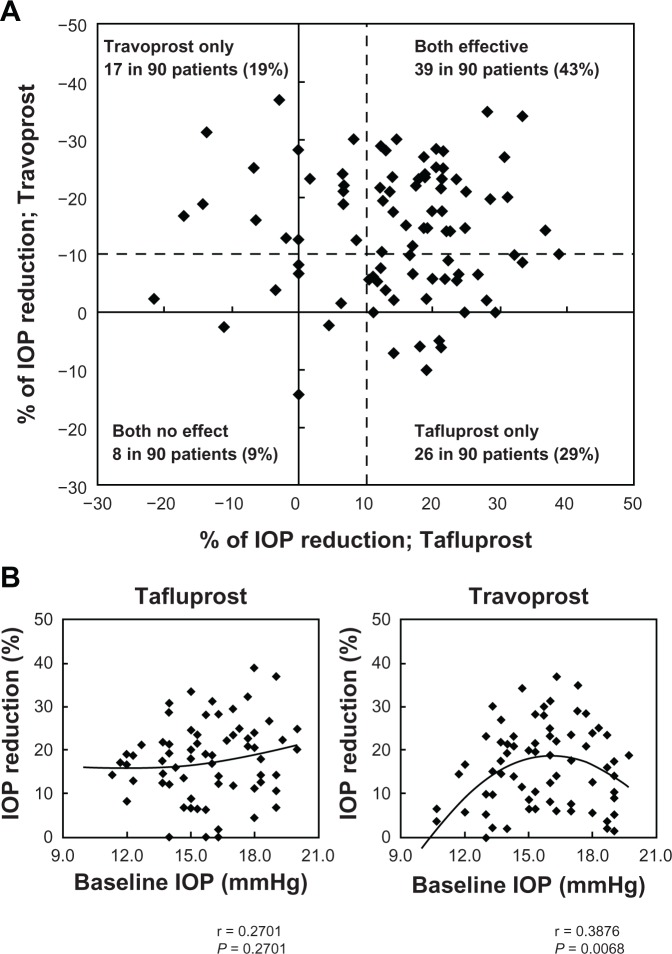
Figure 1.
(A) The relationship between percent reductions of intraocular pressure (IOP) by tafluprost and travoprost. Dashed line represents a border of 10% IOP reduction. (B) Polynomial regression analysis shows the relationship between baseline IOP and percent IOP reduction from baseline IOP.
Abbreviation: IOP, intraocular pressure.

