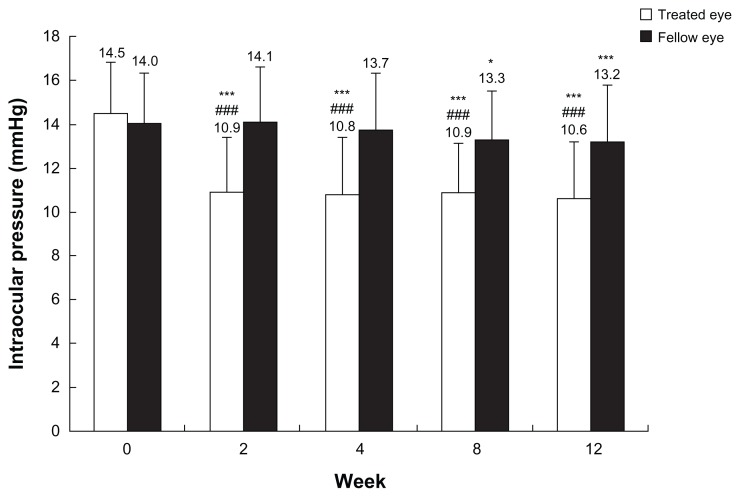
Figure 1.
Intraocular pressure values in treated and fellow eyes.
Notes: Each column represents the mean (plus or minus the standard deviation) intraocular pressure value at each time point; *P < 0.05; ***P < 0.001, for each time point versus baseline, as measured by paired t-test using Bonferroni correction after repeated analysis of variance; ###P < 0.001, for treated eye versus fellow eye at each time point, as measured by unpaired t-test using Bonferroni correction after repeated analysis of variance.

