Figure 4.
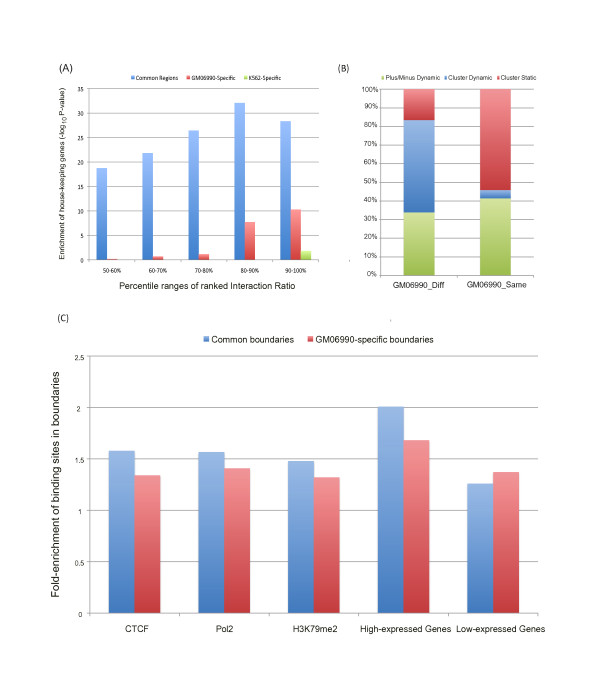
Dynamic analysis of two genomic states and detailed segmentations. (A) Housekeeping genes enrichments in cell-type-common bins, GM-specific bins and K562-specific bins are compared under different percentile ranges of ranked interaction ratios (50-60%, 60%-70%, 70%-80%, 80%-90%, 90%-100%). The Y-axis is the enrichment score (-log10(p-value), from the Binomial test) for each percentile range. Bins with high interaction ratios in both cell lines are more enriched with housekeeping genes. (B) Cluster dynamics analysis of each pair of neighboring bins: the dynamics of the Diff category (two bins belonging to different clusters) and the Same category (two bins belonging to the same cluster) are examined. The fractions of different dynamic activities are displayed with different colors. Green: original category in GM06990 cell line turns into Minus category (two bins with at least one in minus states) in K562 cell line. Blue: the category alters between Diff and Same from GM06990 to K562 cell line. Red: the category does not change from GM06990 to K562 cell line. In GM06990 cell line, only 20% of the pairs in the Diff category remained to be in Diff in K562. Approximately 50% in the Diff category became pairs in the Same category. More than half of pairs of adjacent bins in the Same category remained as the Same in K562. (C) The fold-enrichment of CTCF, Pol II, H3K79me2, top 25% high-expressed genes, and top 25% low-expressed genes in the boundaries of the plus states in GM06990 cell line. Blue: Cell-type common boundaries. Red: GM06990-specific boundaries. The binding sites of CTCF and Pol II and the peaks of H3K79me2 are more enriched in cell-type-common boundaries than in GM06990-specific boundaries. A similar trend can be observed in high-expressed genes, whereas an opposite trend is shown in low-expressed genes.

