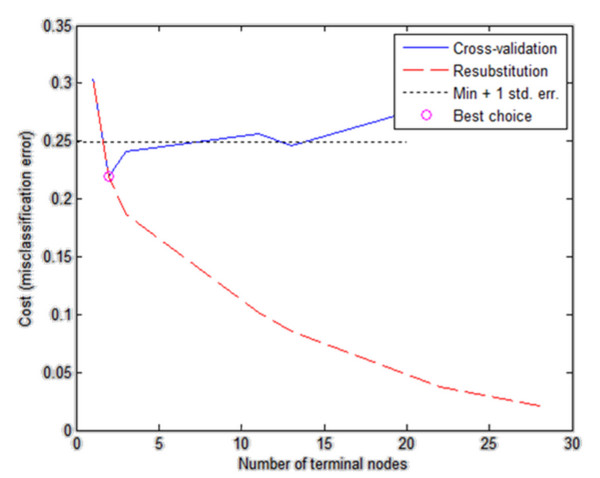
Figure 10.
Graph of classification error changes versus the number of nodes, taking into account the place, where the decision tree was trimmed (best choice). Two cross-validation curves have been shown – the blue colour. The resubstitution is marked red. In addition, the cut off line and the best selection point (red circle) have been marked. The presented graph shows that best choice occurs for cost (misclassification error) equal to 2.15 when the number of terminal nodes is 2. This choice is correct because it is the minimum error for cross validation.

