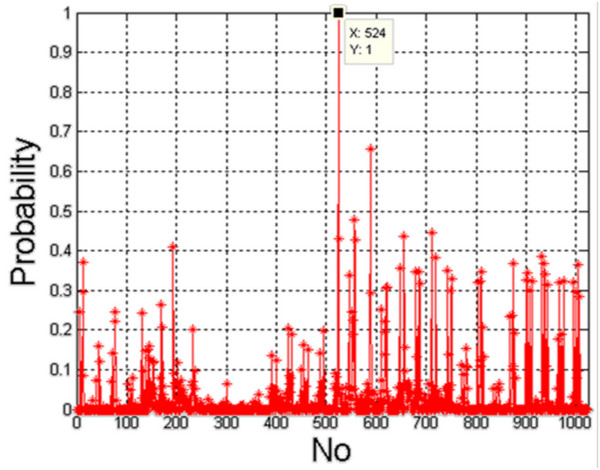
Figure 13.
The graph of occurrence frequency (probability) for individual feature configurations (1 to 1023). The graph shows clearly the most frequent occurrence of features combination for tree number 524. The other decision trees, formed in other feature configurations, occur less frequently. A specific configuration (1 to 1023) is a particular configuration of the features involved in the formation of a decision tree. These values can easily be read taking into account the fact that each of the features w(1) to w(10) may define the next bit of a 10-bit recording. For example, 16 is only the occurrence of the feature w(5), 32 - w(6) and 524 - w(3), w(4) and w(10). The graph shows that the highest incidence was observed for the features w(3), w(4) and (10) together.

